20 – Recommendation Reports
Decision-Making and Criteria
David McMurrey; Jonathan Arnett; Kalani Pattison; and Nicole Hagstrom-Schmidt
The previous parts of this chapter have dealt mostly with expectations regarding the sections of a recommendation or feasibility report. However, underlying the report as a whole, a decision-making process is taking place. Presenting a clear recommendation or suggestions to your audience depends on clearly informing your readers how you reached your decision.
Depending on the structure of your report and the delineation of your research tasks within your results, conclusions, recommendations, or all of these sections, you will have to justify evaluations, comparisons, and decisions that you made in the course of your research. Below are several common places where you may make crucial decisions that affect the content and results of your entire report:
- If one of your research tasks is to determine the best product to buy, and another task is to determine where to install it, you will have to evaluate multiple options as part of the results of those tasks.
- If you administer a survey, conduct interviews, and find secondary resources about website builders, you may have to determine the most important information to include in your conclusion in order to draw your results or findings together into logical conclusions.
- If you find that a suggested course of action isn’t actually going to improve a situation, a decision-making tree or a decision matrix in the recommendation might help support your recommendation of keeping the status quo.
In all of these cases, and in almost all recommendation or feasibility reports, you need to be able to clearly explain your decision-making processes to your audience in an objective way. Three tools that you can use to do so are criteria, decision matrices, and decision trees.
Criteria
Criteria (singular: criterion) are the quantitative and qualitative categories and standards you use to judge something. If your technical report requires you to make a judgment of some sort—is the project feasible? What is the best option? Did the item pass or fail a test?—you should describe and define the factors that guide your decision. Common examples of decision-making criteria include costs, schedules, popular opinions, demonstrated needs, and degrees of quality. Here are some examples:
- If you are recommending a tablet computer for use by employees, your requirements are likely to involve size, cost, hard-disk storage, display quality, durability, and battery life.
- If you are looking into the feasibility of providing every student at Austin Community College with an ID on the ACC computer network, you need to define the basic requirements of such a program: what it would be expected to accomplish, problems that it would have to avoid, and so on.
- If you are evaluating the logistics of the free bus public transportation program in Bryan/College Station for Texas A&M students, you need to know what is expected of the program and then explore costs, locations, and other factors in relation to those requirements.
Criteria may need to be defined on a very specific level. For example, “chocolate flavor” may be a criterion for choosing among brands of chocolate truffles, but what defines a desirable chocolate flavor? Do you want a milk chocolate flavor? A dark chocolate flavor? White chocolate? A high or low percentage of cacao? Sweet, bitter, or spicy? Single-origin cacao beans or a blend? If single-origin, do you want Ghanian, Venezuelan, Honduran, Ecuadorian, or Filipino? The more you know about a criterion, the more precise you can be in your evaluation.
Criteria may also be referred to as requirements and can be defined in three basic ways:
- Numerical values. Many requirements are stated as maximum or minimum numerical values. For example, there may be a cost requirement, such as the tablet computer for employees should cost no more than $900.
- Yes/no values. Some requirements are simply a yes-no question. For instance, does the tablet come equipped with Bluetooth? Is the car equipped with voice recognition?
- Ratings values. In some cases, key considerations cannot be handled either with numerical values or yes/no values. For example, your organization might want a tablet that has an ease-of-use rating of at least “good” by some nationally accepted ratings group. In other situations, you may have to assign ratings yourself.
The criteria section should also discuss how important the individual requirements are in relation to each other. Picture the typical situation where no one option is best in all categories of comparison. One option is cheaper; another has more functions; one has better ease-of-use ratings; another is known to be more durable. Set up your criteria so that they dictate a “winner” from a situation where there is no obvious winner.
Decision Matrices
One useful tool for decision-making based on criteria of varying importance is a decision matrix (plural: matrices). Decision matrices allow for numerical calculations and comparisons of different choices with criteria that have varying levels of importance.
To create a decision matrix, you start with the options to be compared, the criteria to be used to evaluate the options, and the relative weight or importance of each criterion in the decision. Table 20.2[1] shows how a generic decision matrix would be set up.
Table 20.2. Generic decision matrix example.
| Criteria | Weight | Option 1 | Option 2 | Option 3 |
|---|---|---|---|---|
| Criterion 1 | ||||
| Criterion 2 | ||||
| Criterion 3 | ||||
| Criterion 4 | ||||
| Totals: |
In the weight column, each criterion would be given a number within a certain range—from 1 (least important) to 5 (most important), or 1 to 10, depending on how much the levels differ in importance. Some writers may be more comfortable with using percentages out of 100 when considering weight. Criteria can share the same weight or importance. The options would then be scored along a similar scale according to how well they perform in the particular criterion. The weight and score would then be multiplied and the whole column added together to give a total.
The following Table 20.3[2] is a decision matrix reflecting different options for communicating to students in an online course. The weights are given in the shaded columns, the score each option earns for each criterion are shown in bold, and the maroon multiplication next to the score shows how the weight and score are multiplied. These totals are then added for a total of the whole column.
Table 20.3. Example decision matrix with randomly generated data.
| Criteria (Scored 1-5) | Weight (1-5) | Canvas Announcements | Piazza | |
|---|---|---|---|---|
| Ease of Student Access | 4 | 5 (x4=20) | 3 (x4=12) | 5 (x4=20) |
| Frequency of Student Attention | 5 | 1 (x5=5) | 4 (x5=20) | 3 (x5=15) |
| Ease of Professor Use | 3 | 5 (x3=15) | 5 (x3=15) | 3 (x3=9) |
| Formatting Flexibility | 1 | 5 (x1=5) | 4 (x1=4) | 2 (x1=2) |
| Totals: | 45 | 51 | 46 |
As you can see in Table 20.3, if you went strictly by the number of criteria that an option excelled in, you might determine that emails are the best way to contact students. However, if you use the more nuanced decision matrix, then you could conclude that Canvas Announcements are the best way to communicate with students. The varying weights of each criterion and the score each option earns should be based on solid research. This matrix, then, allows you to quantify the reasons for choosing one option over another, despite the weights and scores being a little subjective.
Decision Trees
In addition to making a recommendation based on criteria or on weighted criteria, sometimes recommendations can be made after following a decision tree. Creating a visual representation of a decision tree can be useful in illuminating your thought process so that readers can follow your reasoning. Such decision trees can also be useful in communicating procedures for others to follow, especially in problem-solving situations.
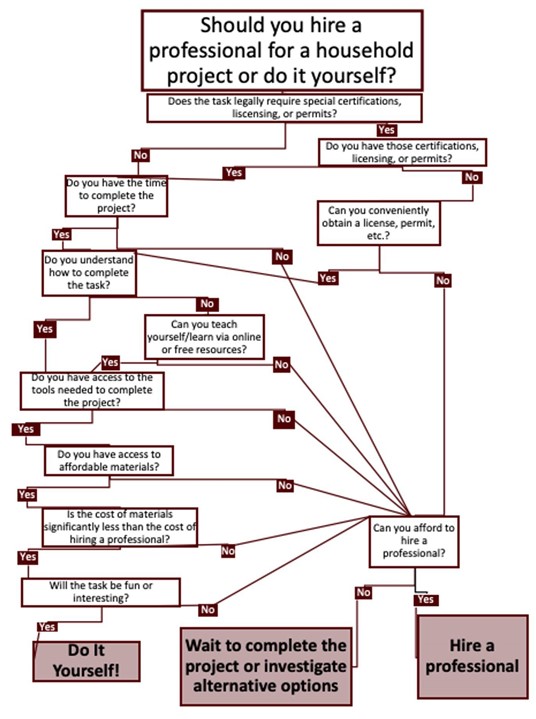
The following decision tree in Figure 20.12[3] illustrates how to determine whether to hire a professional to complete a household project or to do it yourself. As you can see, most decision trees are based on a series of Yes/No, Either/Or limited choices. There may be a choice out of three or four options at a particular step, but that isn’t as common, and so it is not depicted in the example.
This text was derived from
McMurrey, David and Jonathan Arnett, “Recommendation and Feasibility Reports,” in Tiffani Reardon, Tamara Powell, Jonathan Arnett, Monique Logan, and Cassandra Race, with contributors David McMurrey, Steve Miller, Cherie Miller, Megan Gibbs, Jennifer Nguyen, James Monroe, and Lance Linimon. Open Technical Communication. 4th ed. Athens, GA: Affordable Learning Georgia, n.d. https://alg.manifoldapp.org/projects/open-tc. Licensed under a Creative Commons Attribution 4.0 International License.
- Kalani Pattison, “Generic Decision Matrix Example,” 2020. This image is licensed under a Creative Commons Attribution-NonCommercial-ShareAlike 4.0 International License. ↵
- Kalani Pattison, “Example Decision Matrix with Randomly Generated Data,” 2020. This image is licensed under a Creative Commons Attribution-NonCommercial-ShareAlike 4.0 International License. ↵
- Kalani Pattison, “Example of Decision Tree,” 2020. This image is licensed under a Creative Commons Attribution-NonCommercial-ShareAlike 4.0 International License. ↵
The quantitative and qualitative categories and standards used to evaluate something. (singular: criterion)
