Purpose of the project: get familiar with the idea of creating a velocity function based on position data
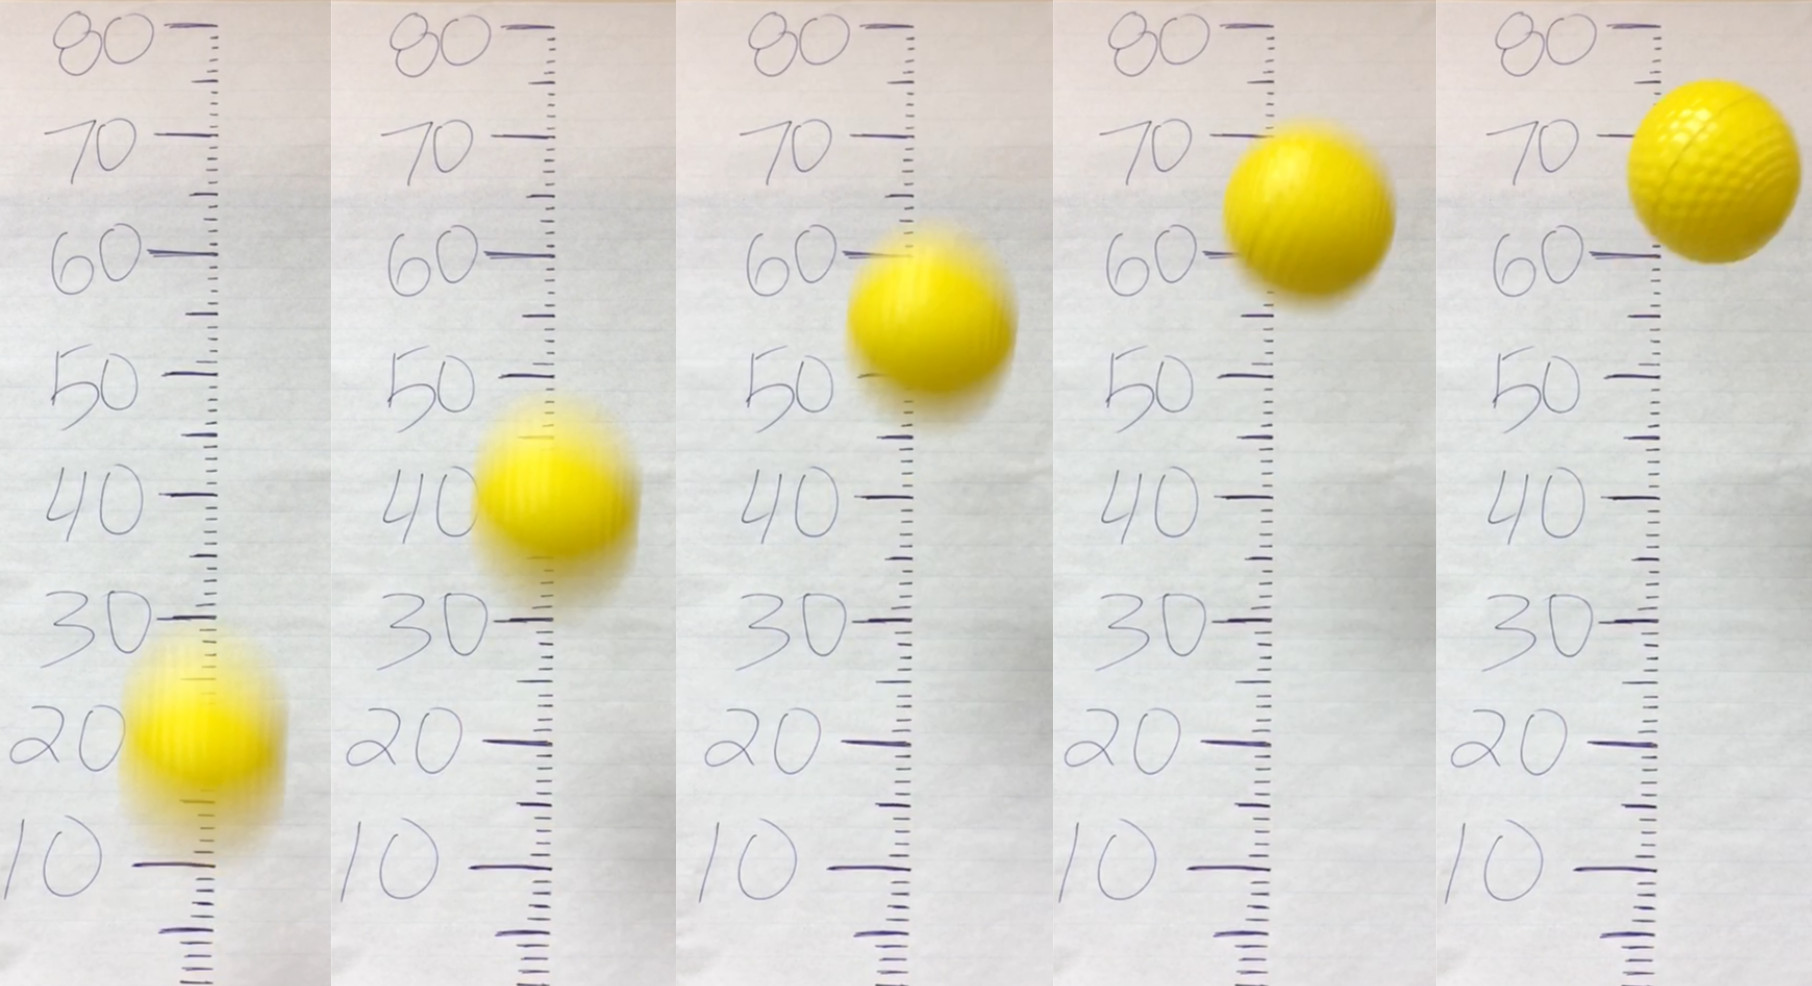
Above are frames from a video of a simple ball toss. Every other frame from the 30 frames per second video is shown, so the time between the frames is approximately [latex]1/15[/latex] of a second.
- Fill in the position data for each time in the table below. Velocity is usually defined as [latex]\frac{\text{Position}}{\text{Time}}[/latex]. How could you calculate velocities for each data point? Fill these in as well.
Time (s) Position (cm) Velocity (cm/s) [latex]0[/latex] [latex]\frac{1}{15}[/latex] [latex]\frac{2}{15}[/latex] [latex]\frac{3}{15}[/latex] [latex]\frac{4}{15}[/latex] - Create two graphs, either by hand or with graphing software: position versus time, and velocity versus time. In each case, time is the [latex]x[/latex]-axis, while the [latex]y[/latex]-axis is position in the first graph and velocity in the second graph. How are the two graphs related?
Going from a position graph to a velocity graph like this is called a derivative, which we’ll talk a lot more about in upcoming chapters.
- While your velocity graph is probably not a perfect line, imagine that it is linear for a second. What is the slope of the velocity graph? This is the rate of acceleration due to gravity, an important quantity in physics.
