10.4 Compute and interpret segment margin in an organisation.
Rina Dhillon
Profit centres and Segmented Income Statements
Profit centres are evaluated using Segmented Income Statements which calculate profit for each segment of a business in addition to the company as a whole. Although it is relatively easy to keep track of sales by segment, tracing costs to a particular segment and deciding how to treat costs (variable or fixed) that may benefit more than one segment can be complicated. Variable costs are typically traced directly to a segment, since they vary in direct proportion to sales volume and can be allocated to a segment on that basis. On the other hand, fixed costs that can be easily and conveniently traced to a segment are usually assigned to that segment, while common costs, benefiting multiple segments, are not allocated for performance evaluation purposes. The reason for this is that segment costs should only include all costs actually caused by the segment – traceable fixed costs, not all costs attributable to that segment.
Traceable fixed costs arise because of the existence of a particular segment, and therefore can be traced to that segment. An example of this is the salary of the segment manager, his or her salary arises due to the segment. Common fixed costs, to the contrary, arise because of the overall operation of the company and benefit multiple segments. This means they cannot be traced to a single segment. As a result, they are included only at the total company level. For example, the salary of the company’s CEO – the incurrence of this salary is for an employee that oversees many segments with the company and given it cannot be directly traced to a particular segment, it should be treated as a common cost and not allocated to a particular segment. A good test for deciding whether to allocate indirect fixed costs, such as the salary of a business’ CEO, is to determine whether the cost would be reduced or eliminated if the segment were eliminated. Even if we eliminated a particular segment, the CEO will still be drawing a salary as he or she will be overseeing other segments. Thus if the cost cannot be reduced or eliminated, it is referred to as a common cost.
In practice, companies sometimes allocate a portion of common costs from headquarters to segments without using them for performance evaluation purposes. This practice has the advantage of making the segment manager aware that the cost is being incurred and that the cost must ultimately be paid for by revenue generated by the segment. If other indirect costs are to be allocated to segments, there should be sufficient causal relationships between the costs and the segments. Arbitrary allocations may lead to less-than-optimal decisions about a segment.
Let us now turn our attention to segment income reports and how they can be used to make decisions and evaluate the performance of sub-units operating as profit centres. Below a segmented income statement is provided for a hypothetical accounting firm offering services in three departmets: tax, audit and consulting:

As illustrated in the segmented income statement above, the accounting firm has a total client billings of $1 million, with 50% (500000/1000000) provided by the services rendered by the tax department, 40% (400000/1000000) contributed by the audit department and the remaining 10% (100000/1000000) from the consulting department. The tax department is further broken down into individual (specialising in individual tax returns) and business (specialising in business tax returns) divisions.
Let us assume that the $100000 traceable fixed costs to the tax department comprises of $20000 of advertising promoting the tax department as a whole, $75000 for the salary of the tax department manager and $5000 for computer software used for tax preparation. Note that although $100000 of fixed costs were traced to the tax department in the first segmented income statement above, only $80000 are subsequently traced to the individual and business tax divisions. $20000 of traceable costs have become common costs because the advertising costs for the tax division cannot be directly traced to either the individual or the business division.
The standard format for a segmented income statement is provided below:

Contribution margin, highlighted in yellow above, is primarily a measure of short-run profitability, as it ignores fixed costs (as you would have learnt in CVP and special order analyses in AAA). Conversely, segment margin which is highlighted in red above, is a measure of long-term profitability and is more appropriate in addressing long-term decisions, such as whether to drop divisions, product lines, stores, etc. In the case of the hypothetical accounting firm above, the segment margin of the tax department is positive but the segment margin of the individual tax division is negative. In the long-run, the individual tax division is not profitable. The accounting firm may consider eliminating the individual tax division but before doing so, they should consider all factors – both quantitative and qualitative – including if eliminating the individual tax division would have any impact on the profits earned by the business tax division. For example, if most of the clients of the tax department are small business owners running companies who want to engage an accounting firm that provides a full tax service of individual tax returns (from the perspective of individual employees) and business tax returns (from the perspective of the company’s earnings), they might still want to retain the loss-making individual tax division given that it may impact income in the business tax division. Perhaps they might then focus their attention on how to make the individual tax division more profitable – perhaps by reducing their variable costs which is a whopping 80% (80000/100000) of service revenue or by providing additional financial planning services that may allow them to earn more service revenue from individual taxpayers.
Keeping It Real: Wesfarmers Group Segment Report
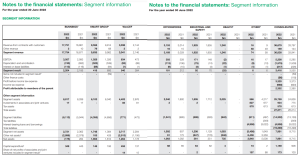
The above picture is a snapshot of Wesfarmers Group’s 2022 segment report for their sub-units: Bunnings, Kmart Group, WesChemicalEnergy&Fertiliser, Officeworks, Industrial and Safety, Health and Other (which includes dividends earned from their continuing interest as shareholders of Coles Limited which they demerged from in 2018). All segments performed well except for Health which had non-cash expenses of $11 million relating to amortisation and trade through of the incremental asset value recognised as part of the acquisition and impairment costs of $21 million relating to Priceline company owned stores.
In the next section, we move on to investment centres and better understand the basis for evaluating the performance of investment centre managers.