11.4 Consider triple bottom line reporting and sustainability-related KPIs
Leanne Gaul and Rina Dhillon
Integrating all sustainability capitals (economic, environmental, and social) into one report provides a holistic perspective of a company’s approach to their overall performance, this is called Triple Bottom Line (TBL) reporting and is reflected in the Integrated Reporting method (<IR>).[1] <IR> uses integrated thinking to consider how an organisation creates value from financial, environmental and social perspectives over the short, medium and long term.[2] Its aim is to productively allocate capital, promote cohesive and efficient approaches to reporting and enhance accountability.[3]
The TBL system puts forward that in order to better understand an organisation’s performance, a consideration of its financial performance must be judged against its social and environmental impacts (positive and negative), in order to more completely appreciate its impact on broader societies. Given this, TBL focuses on three perspectives:
- Economic perspective – Broadly relates to the financial performance of an organisation, incorporating its profit and loss statement, and other economic indicators such as market share price.
- Social perspective – The degree to which societies within physical, financial and influential proximity of an organisation has been impacted by its operations.
- Environmental perspective – The degree to which natural environments have been impacted by an organisation’s operations.
Let’s us look at an Australian example of TBL Reporting
Cbus is an Australian industry super fund founded in 1984. This organisation produced its Cbus Annual Integrated Report 2020 which incorporates disclosures on strategy, governance, performance, and prospects for the benefit of members and stakeholders. Their strategy (vision and mission statement) puts the interests of their members at the centre of organisational decision making and also aims to provide strong returns for investors.[4] Cbus stakeholders are categorised in three levels as demonstrated below:

How might sustainability indicators be developed and operationalised (made to work)? A measured approach must be taken in developing KPIs for an organisation to ensure the mission statement and associated goals and objectives are supported. As such a 7-step checklist for the development of aligned sustainability KPIs in organisations is considered below. The checklist elements have been matched to the climate change action KPI from Cbus SDGs in the diagram below to gain a deeper understanding of how they are applied:

- Identifying a strategic imperative– Align goals consistent with an organisation’s strategy. An organisation’s strategy defines how it pursues the attainment of its objectives. Therefore, whatever indicators we devise must be consistent with an organisation’s strategy. In the case of Cbus, members are the nexus of decision making. Cbus is creating desirable outcomes for its members by operating sustainably, protecting the environment and community in which they live and providing better returns on investment supports the 3Ps, profit, planet, and people.[1]
- Broad operational categories relating to strategic imperatives– Focuses on broad areas relating to that strategic imperative. In order to achieve an organisation’s strategy, management usually focuses on broad areas relating to that strategic imperative. For example, an organisation that seeks to maximise profits might focus on customers to raise revenues, as well as processes to reduce costs by minimising non-value-adding activities. Here, Cbus provides a broad range of economic, environmental, and social factors which reflect their mission statement, as outlined in the diagram above. For examples, take urgent action on climate change SDG 13, which benefits members and society.
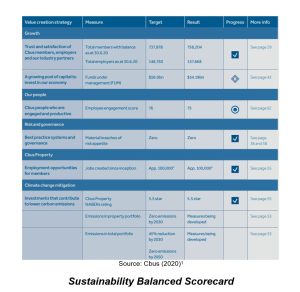
- Selecting financial and operating information to help chart the operational categories– Within each of these categories, we select key pieces of information. It might be revenues, number of customers, overall production costs, wastage, staff hours lost through employee injury, etc. Any financial or operating number that we think contributes to telling a story about our performance. As indicated in Cbus’ balanced scorecard above, action on climate change is required to meet a rating of 5.5 stars (target column). Some aspects continue to be developed.
- Assess relationships between the information selected to create performance indicators for categories – By combining different information pieces to create ratios, or by simply using individual information as raw numbers, we populate each category with a series of indicators that paint a picture of our performance in that category. As indicated in Cbus’ balanced scorecard above, the progress on this climate action KPI is meeting set targets (results and progress columns). The first four steps above lead us to establishing sustainability performance indicators and these indicators must be SMART – Specific; Measurable; Achievable/Attainable; Realistic/Relevant; Timely. How do we make these sustainability KPIs work in businesses, Steps 5 to 7 is required and detailed below:
- Identify levels of performance for indicators– Having determined a raw number or ratio as being an indicator, what levels do you believe necessarily define ‘good’ performance? The setting of a sufficient level is extremely important as good measures can be rendered irrelevant by target levels being too difficult or to easy to attain. For example, Cbus has zero emission in property portfolio by 2030 as good performance related to progress and action on climate change.
- Defining rewards for their attainment– If employees attain these indicators, how are you going to reward them? Reward systems usually motivate employees. In the instance of Cbus, the business has not indicated or disclosed a reward basis and this is not discussed within this KPI as it is a question of relevance to climate change action. It would be incorporated with KPIs over employee performance (for example Cbus provides open and inclusive relationships and good working conditions resulting in reduced staff turnover ~ 4.29% when compared with industry standard ~12%.
- Identify feedback systems to manage success/failure in attaining indicators– At the end of a period, what do we do when a target is or isn’t met? It is as important to reflect on the extent to which we might improve targets that have been met, as it is to consider how we might change our practices to ensure the future attainment of targets that have not been met. In Cbus case, its sustainability balanced scorecard provides clear advice on whether targets are, or are not, being met and links to other parts of the report with a deeper discussion on outcomes.
The financial reports produced in the <IR>, provided below, are very similar to an annual reports, as compliance requirements over Australian Accounting Standards and the Corporations Act 2001 (Cth) must still be met:

This does not mean these figures do not incorporate the costs and benefits of a more sustainability driven organisation, merely that they are not as obvious in this form of disclosure. You will need to look beyond this scope into the other disclosures which can incorporate qualitative and/or quantitative measures. For example; gender equality was a given KPI in line with SDG5, which is reported on page 60 incorporating 2019 and 2020 performance and the related target:

Disclosure of the gender equity issue (diagram above) ensure that Cbus is behaving in a transparent and accountable manner to disclose to report users the decline and improvements in areas of performance within this KPI and how it is being addressed.
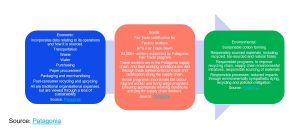
For a more interactive approach Patagonia, an American clothing manufacturer, has a digital sustainability report. They have taken a sustainability approach to operations with a view to reducing the use of plastic fibres in their clothing range. For example polyester is a manmade fibre made from plastic, these fibres infiltrate our ecosystems and waterways and become embedded within the aquatic food chain. If the clothes do make it to land fill, which is called municipal solid waste (MSW), it causes an increasing problem for waste management facilities, with 500,000 tonnes of leather and textiles being disposed of by Australians in the 2009 to 2010 financial year.[1] Globally 87% of all textiles are added to landfill or incinerated, of the remaining 13%, 12% is recycled into insulation or rags and only 1% is treated and reused as raw materials.[2] In terms of incineration other issues arise, such as the releasing of toxic pollutants into the air.[3] To reduce clothing waste issues significant research and development must be considered by supply chains. Alternative actions could involve sourcing natural fibres, using recycled materials and offering a recycling service for returning customers.
Additional factors in driving a more sustainable clothing industry are those savvy consumers making more informed decisions.[4] Returning to the Patagonia example, this company is sourcing preferred materials (89%) including a mixture of natural fibres and recycled materials.[5] From a supply chain perspective 87% of the Patagonia line is Fair Trade compliant which seeks to protect workers’ rights in the supply chain.[6] Patagonia is a Certified B corporation achieving an overall impact score of 151.4, which is outstanding from a sustainability perspective as the median score for businesses completing the B corporation assessment is 50.9.[7] Patagonia has achieved best in community and environment over the last two years, as awarded by B corporation.[8] Patagonia’s TBL report is provided below:
Another clothing manufacturer is a well-known brand Shein and, in terms of its apparel factory workers, most of its 700 suppliers, identified through an audit of factory processes, required corrective action (83%). Only 2% of suppliers met performance requirements with minor flaws and 15% having a moderate performance with some general risks, improvements advised.[9] The top breaches include fire and emergency preparedness (27%) and working hours (14%).[10] In terms of protecting the environment, Shein’s disclosure does not include performance data, only prospective practices, or language such as “increasing use of recycled materials in packaging”. Without definitive performance measures these reports are ineffective and can be viewed as green washing rather than effective sustainability reporting.[11]
The three companies discussed in this section provide very different views toward sustainability reporting and help us to understand the variations in these disclosures. With increasing demands for climate change action, customer expectations are going to increasingly turn toward greater organisational transparency over sustainability impacts. Businesses will have to develop reporting that conveys appropriate and relevant information about their operational impacts on the environment and society, hence the accountant’s role will continue to expand beyond the traditional scope of financial reporting to meeting the accountability demands of stakeholders.[12]
[1] Ross, G. (2019, Aug 27). Australia recycles paper and plastics. So why does clothing end up in landfill? The Guardian. https://www.theguardian.com/commentisfree/2019/aug/27/australia-recycles-paper-and-plastics-so-why-does-clothing-end-up-in-landfill. (accessed 30 September 2022).
[2] ibd
[3] Baraniuk, C. (n.d.). Will fashion firms stop burning clothes? BBC Earth. https://www.bbcearth.com/news/will-fashion-firms-stop-burning-clothes. (accessed 30 September 2022).
[4] Petro, G. (2022, March 11). Consumers demand sustainable products and shopping formats. Forbes. https://www.forbes.com/sites/gregpetro/2022/03/11/consumers-demand-sustainable-products-and-shopping-formats/?sh=28d9d2406a06. (accessed 30 September 2022).
[5] Patagonia. (2022). Environmental responsibility. https://www.patagonia.com/environmental-responsibility-materials/. (accessed 26 September 2022).
[6] Patagonia. (2022). Environmental responsibility. https://www.patagonia.com/social-responsibility/. (accessed 26 September 2022).
[7] B Corporation. (2022). Patagonia works. https://www.bcorporation.net/en-us/find-a-b-corp/company/patagonia-inc. (accessed 26 September 2022)
[8] Ibid.
[9] Shein. (2021). Shein: 2021 Sustainability and social impact report. https://us.shein.com/2021-Sustainability-and-Social-Impact-Report-a-1218.html. (accessed 26 September 2022). p. 11.
[10] Ibid. p. 12.
[11] Shein. (2021). Shein: 2021 Sustainability and social impact report. https://us.shein.com/2021-Sustainability-and-Social-Impact-Report-a-1218.html. (accessed 26 September 2022).
[12] Williams, B., Lodhia, S., Arora, M. P., & McManus, L. (2020). The institutional change in the role of the public sector accountant in facilitating accountability: A longitudinal study of Australian local councils. Managerial auditing journal, 36(2): 314-333.
[1] Kraaijenbrink, J. (2019, Dec 10). What the 3)s of the Triple Bottom Line really mean. Forbes. https://www.forbes.com/sites/jeroenkraaijenbrink/2019/12/10/what-the-3ps-of-the-triple-bottom-line-really-mean/?sh=22f714575143 . (accessed 30 September 2022).
[1] Gray, R. (2006). Social, environmental and sustainability reporting and organisational value creation? Accounting, auditing and accountability, 19(6), 793-819.
[2] International Financial reporting Standards Foundation. (2022). About us. https://www.integratedreporting.org/the-iirc-2/
[3] ibid
[4] Cbus. (2020). Building a better future: Annual integrated report 2020. https://examples.integratedreporting.org/fragments/governance-47/. (accessed 25 September 2020).