6.2 Calculate the cost of goods sold using the perpetual and periodic inventory recording systems
Rina Dhillon; Mitchell Franklin; Patty Graybeal; and Dixon Cooper
Inventory costing
Inventory costing is accomplished by one of three specific costing methods: (1) first-in, first-out (FIFO), (2) last-in, first-out (LIFO), and (3) weighted-average (WA) cost methods. All three methods are techniques that allow management to distribute the costs of inventory in a logical and consistent manner, to facilitate matching of costs to offset the related revenue item that is recognised during the period, in accordance with expense recognition and matching concepts. In Australia, AASB 102 does not allow the use of the second method, LIFO. Nevertheless, LIFO is still used globally by other countries such as Japan and US.
Note that a company’s cost allocation process represents management’s chosen method for expensing product costs, based strictly on estimates of the flow of inventory costs, which is unrelated to the actual flow of the physical inventory. Use of a cost allocation strategy eliminates the need for often cost-prohibitive individual tracking of costs of each specific inventory item, for which purchase prices may vary greatly.
In this section, you will be provided with a basic demonstration of each of the three allocation methods, and then further delineation of the application and nuances of the two costing system – perpetual and periodic – introduced in the previous section.
To illustrate each method, the following example from In Style Fashion will be used. Assume that In Style Fashion has the following inventory activity for September:
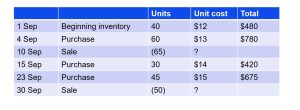
We will begin exploring each of the allocation methods using the perpetual inventory system.
Cost Allocation Methods, but Specific to Perpetual Inventory System
As you’ve learned, the perpetual inventory system is updated continuously to reflect the current status of inventory on an ongoing basis. Modern sales activity commonly uses electronic identifiers—such as bar codes and RFID technology—to account for inventory as it is purchased, managed/monitored, and sold.
Regardless of which cost assumption is chosen, recording inventory sales using the perpetual method involves recording both the revenue and the cost from the transaction for each individual sale. As additional inventory is purchased during the period, the cost of those goods is added to the inventory account. Normally, no significant adjustments are needed at the end of the period (before financial statements are prepared) since the inventory balance is maintained to continually parallel actual counts. Let’s look closely at how inventory purchases and sales during the period are calculated using the first-in, first-out (FIFO) method.
First-in, First-out (FIFO)
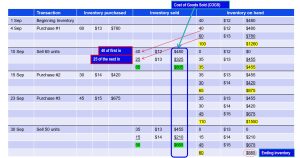
The FIFO method of cost allocation assumes that the earliest units purchased are also the first units sold. For In Style Fashion, using the perpetual inventory system, the first sale of 65 units is assumed to be the 40 units from the beginning inventory, which had cost $12 per unit, and the remaining 25 units from the purchase made on 4th September, which had cost $13 per unit, bringing the total cost of these units to $805 [(40 x 12) + (25 x13)]. Once those units were sold, there remained 35 more units of the 4th September purchased inventory. The company bought 30 more units for $14 per unit and 45 more units for $15 per unit on 15th September and 23rd September respectively. At the time of the second sale of 50 units, the FIFO assumption directs the company to cost out the last 35 units of the 4th September purchased inventory, plus 15 of the units that had been purchased for $14 on 15th September. Ending inventory was made up of 15 units at $14 each, and 45 units at $15 each, for a total FIFO perpetual ending inventory value of $885.
The FIFO costing assumption tracks inventory items in the order that they were acquired, so that when they are sold the earliest acquired items are used to offset the revenue from the sale. For many businesses, the FIFO assumption may match the actual physical flow of their inventory. It is important to note that this is an assumption – the actual items sold cannot be identified, they could be the oldest, the newest or any combination. The table below illustrates the calculation of cost of goods sold and ending inventory under the FIFO method:
Description of Journal Entries for Inventory Sales, Perpetual, First-in, First-out (FIFO)
Journal entries are not shown, but the following discussion provides the information that would be used in recording the necessary journal entries. Each time a product is sold, a revenue entry would be made to record the sales revenue and the corresponding accounts receivable or cash from the sale. When applying perpetual inventory system, a second entry made at the same time would record the cost of the item based on FIFO, which would be shifted from inventory (an asset) to cost of goods sold (an expense).
Last-in, First-out (LIFO)
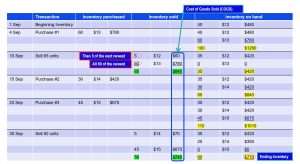
The last-in, first-out method (LIFO) of cost allocation assumes that the last units purchased are the first units sold. For In Style Fashion, using perpetual inventory system, the first sale of 65 units is assumed to be the 60 units from the 4th September purchase, which had cost $13 per unit and 5 units from the beginning inventory, which had cost $12 per unit, bringing the total cost of these units in the first sale to $840 [(60 x $13) + (5 x $12)]. Once those units were sold, there remained 35 more units of beginning inventory. The company bought 30 more units for $14 per unit and 45 more units for $15 per unit on 15th September and 23rd September respectively. At the time of the second sale of 50 units, the LIFO assumption directs the company to cost out the 45 units from the latest purchased units, which had cost $15 per unit and the remaining 5 units from the earlier purchase on 15th September at $14 per unit, for a total cost on the second sale of $745 [(45 x 15)+(5 x 14)]. Ending inventory was made up of 25 units at $14 each and 35 units at $12 each, for a total LIFO perpetual ending inventory value of $770.
The LIFO costing assumption tracks inventory items in the order that they were acquired, so that when they are sold, the latest acquired items are used to offset the revenue from the sale. The table below illustrates the calculation of cost of goods sold and ending inventory under the LIFO method:
Description of Journal Entries for Inventory Sales, Perpetual, Last-in, First-out (LIFO)
Journal entries are not shown, but the following discussion provides the information that would be used in recording the necessary journal entries. Each time a product is sold, a revenue entry would be made to record the sales revenue and the corresponding accounts receivable or cash from the sale. When applying perpetual inventory system, a second entry made at the same time would record the cost of the item based on LIFO, which would be shifted from inventory (an asset) to cost of goods sold (an expense).
Weighted-Average Cost (WA)
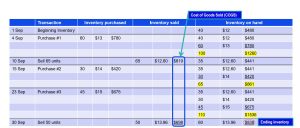
Weighted-average cost allocation requires computation of the average cost of all units in goods available for sale at the time the sale is made for perpetual inventory calculations. For In Style, the first sale of 65 units is assumed to be the units from the beginning inventory of 40 units, which had cost $12 per unit, and the purchase of 60 units on 4th September at a cost of $13 per unit. At this juncture, an average cost will be calculated using the following formula:
Average unit cost = Cost of Goods Available for Sale / Units Available for Sale
$12.60 = [(40 x 12) + (60 x 13)] / (40+60)
This brings the total cost of these units in the first sale to $819 (65 x $12.60). Once those units were sold, there remained 35 more units of the inventory, which still had a $12.60 average cost. The company bought 30 more units for $14 per unit and 45 more units for $15 per unit on 15th September and 23rd September respectively. Recalculating the average cost, after these purchases, is accomplished by dividing total cost of goods available for sale (which totalled $1536 at that point) by the number of units held, which was 110 units, for an average cost of $13.96 per unit. At the time of the second sale of 50 units, the WA assumption directs the company to cost out the 50 at $13.96 for a total cost on the second sale of $698 (50 x $13.96). Ending inventory was made up of 60 units at $13.96 each for a total WA perpetual ending inventory value of $838 (60 x $13.96).
The WA costing assumption tracks inventory items based on lots of goods that are combined and re-averaged after each new acquisition to determine a new average cost per unit so that, when they are sold, the latest averaged cost items are used to offset the revenue from the sale. The table below illustrates the calculation of cost of goods sold and ending inventory under the WA method:
Description of Journal Entries for Inventory Sales, Perpetual, Weighted Average (AVG)
Journal entries are not shown, but the following discussion provides the information that would be used in recording the necessary journal entries. Each time a product is sold, a revenue entry would be made to record the sales revenue and the corresponding accounts receivable or cash from the sale. When applying perpetual inventory system, a second entry would be made at the same time to record the cost of the item based on the WA costing assumptions, which would be shifted from inventory (an asset) to cost of goods sold (an expense).
Keeping it Real
Perpetual inventory has been seen as the wave of the future for many years. It has grown since the 1970s alongside the development of affordable personal computers. Universal product codes, commonly known as UPC barcodes, have advanced inventory management for large and small retail businesses, allowing real-time inventory counts and reorder capability that increased popularity of the perpetual inventory system. These UPC codes identify specific products but are not specific to the particular batch of goods that were produced. Electronic product codes (EPCs) such as radio frequency identifiers (RFIDs) are essentially an evolved version of UPCs in which a chip/identifier is embedded in the EPC code that matches the goods to the actual batch of product that was produced. This more specific information allows better control, greater accountability, increased efficiency, and overall quality monitoring of goods in inventory. The technology advancements that are available for perpetual inventory systems make it nearly impossible for businesses to choose periodic inventory and forego the competitive advantages that the technology offers.
Visit this Amazon inventory video for a little insight into some of the inventory challenges experienced by retail giant Amazon to learn more.
We will now turn to exploring each of the allocation methods using the periodic inventory system.
Cost Allocation Methods, but Specific to Periodic Inventory System
As you’ve learned in the previous section, the periodic inventory system is updated at the end of the period to adjust inventory numbers to match the physical count and provide accurate inventory values for the balance sheet. The adjustment ensures that only the inventory costs that remain on hand are recorded, and the remainder of the goods available for sale are expensed on the income statement as cost of goods sold. Since a periodic system does not update the inventory and the cost of goods sold accounts during the period, balances in these accounts must be calculated at the end of the period using the following 3 steps:
Here we will demonstrate the mechanics used to calculate the ending inventory values using the three cost allocation methods and the periodic inventory system. The following is a summary of In Style Fashion’s inventory purchases for September:

First-in, First-out (FIFO)
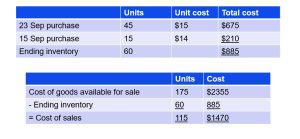
The first-in, first-out method (FIFO) of cost allocation assumes that the earliest units purchased are also the first units sold. For In Style Fashion, considering under the FIFO method, the earliest inventory acquisitions are considered sold first, then the units that remain under FIFO are those that were purchased last. Following that logic, ending inventory included 45 units purchased at $15 and 15 units purchased at $14 each, for a total FIFO periodic ending inventory value of $885. Subtracting this ending inventory from the $2355 total of goods available for sale leaves $1470 in cost of goods sold/cost of sales this period.
 Last-in, First-out (LIFO)
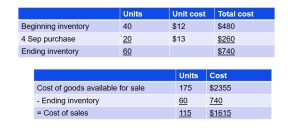
The last-in, first-out method (LIFO) of cost allocation assumes that the last units purchased are the first units sold. For In Style Fashion, considering under the LIFO method, the latest inventory acquisitions are considered sold first, then the units that remain under LIFO are those that were purchased first. Following that logic, ending inventory included 40 units purchased at $12 and 20 units purchased at $13 each, for a total LIFO periodic ending inventory value of $740. Subtracting this ending inventory from the $2355 total of goods available for sale leaves $1615 in cost of goods sold/cost of sales this period.
Weighted-Average Cost (AVG)
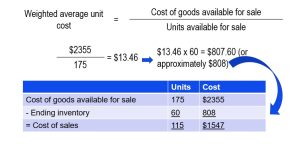
Weighted-average cost allocation requires computation of the average cost of all units in goods available for sale at the time the sale is made. For In Style Fashion, considering the entire period, the weighted-average cost is computed by dividing total cost of goods available for sale ($2355) by the total number of available units (175) to get the average cost of $13.46. Note that 60 of the 175 units available for sale during the period remained in inventory at period end. Following that logic, ending inventory included 60 units at an average cost of $13.46 for a total WA periodic ending inventory value of approximately $808. Subtracting this ending inventory from the $2355 total of goods available for sale leaves $1547 in cost of goods sold/cost of sales this period. It is important to note that final numbers can often differ by one or two cents due to rounding of the calculations. In this case, the cost comes to $13.4571 but rounds up to the stated cost of $13.46.
Summary of inventory costing methods
The above illustrations show that a business’ choice of inventory costing method affects its cost of goods sold/cost of sales and its ending inventory. The table below compares the results of each of the three cost allocation assumptions under the perpetual system and summarises these effects for In Style Fashion:

The above table utilises the cost of goods sold model which summarises a business’ inventory activity during a period. This model starts with the beginning inventory and adds the purchases to yield the cost of goods available for sale. This total cost of inventory that is available to the business to sell during the period is then allocated to what was sold during the period (i.e. cost of goods sold / cost of sales) and any remaining is allocated to what was not sold during the period (i.e. ending inventory).
For In Style Fashion, it began the month with 40 units costing $480 and purchased an additional 135 units for a cost of $1875 during the month. This meant that In Style Fashion had 175 units with a total cost of $2355 available to sell during the month. This scenario would be the same regardless of the inventory costing system chosen by the business. However, the cost of the 115 units that the business ended up selling during the month and the 60 remaining inventory on hand at the end of the month depends on the cost allocation assumptions used.
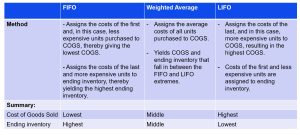
The FIFO method assigns the costs of the first and, in this case, less expensive units purchased to Cost Of Good Sold (hereafter COGS), thereby giving the lowest COGS. Additionally, FIFO assigns the costs of the last and more expensive units to ending inventory, thereby yielding the highest ending inventory.
The LIFO method, on the other hand, assigns the costs of the last, and in this case, more expensive units to COGS, resulting in the highest COGS. Additionally, LIFO assigns the costs of the first and less expensive units to ending inventory, thereby yielding the lowest ending inventory.
Lastly, the Weighted Average (WA) assigns the average costs of all units purchased to COGS. Thus, WA yields COGS and ending inventory that fall in between FIFO and LIFO.
Thus when a business experiences rising prices (especially in the current post-pandemic climate where inflation is at an all time high) for its inventory, these differences between the cost allocation methods will persist. These differing relationships are summarised in the table below:
We now turn our attention to what happens when there are inventory errors.
