Understanding the cost equation
Amanda White; Dixon Cooper; Mitchell Franklin; and Patty Graybeal
To be able to complete any cost-volume-profit (CVP) analysis, first we must understand some basic information about costs that businesses incur.
Costs can be classified in many ways – and there can be many starting points in terms of categorising costs – but let’s start with the following classifications:
- Variable costs
- Fixed costs
- Mixed costs
Variable costs change as the quantity of goods or services produced or provided changes. Fixed costs are exactly as the name implies – they remain the same regardless of the quantity / volume of goods or services produced within the period. Mixed costs are those a combination of variable and fixed components (and when conducting CVP analysis, we will break mixed costs into fixed and variable components).
Consider the following example. Amantha’s Artistry (AA) makes sweet treats. Amantha’s variable costs are flour, butter, sugar, vanilla essence and other ingredients in her cupcakes. The fixed costs are the rent for her store and public liability insurance. Amantha’s mixed costs include her utilities. Electricity for example, has a fixed component (a monthly access charge) and a variable component based on how much electricity is used (which is dependent on how many hours a day the ovens are in use).
This can be represented in an equation

where Y is the total cost, a is the fixed cost, b is the variable cost per unit, and x is the level of activity.
The cost equation is a linear equation that takes into consideration total fixed costs, the fixed component of mixed costs, and variable cost per unit. Cost equations can use past data to determine patterns of past costs that can then project future costs, or they can use estimated or expected future data to estimate future costs.
Let’s take a more in-depth look at the cost equation by examining the costs incurred by Amantha’s Artistry in the manufacture of sweet treats, as shown in the table below.
| Cost Information for Amantha’s Artistry | ||
|---|---|---|
| Cost Incurred | Fixed or Variable | Cost |
| Rent on premises | Fixed | $20,000 per year |
| Public liability insurance | Fixed | $15,000 per year |
| Ingredients | Variable | $2 per treat |
| Staff labour | Variable | $1 per treat |
By applying the cost equation, Amantha’s Artistry can predict its costs at any level of activity (x) as follows:
- Determine total fixed costs: $30,000 + $15,000 = $35,000
- Determine variable costs per unit: $2 + $1 = $3
- Complete the cost equation: Y = $35,000 + $3x
Using this equation, Amantha’s Artistry can now predict its total costs (Y) for any given level of activity (x), as show in the table below
| Treats produced per annum | Cost equation | Total costs |
| 5,000 | Y = $35,000 + ($3 x 5,000) | $50,000 |
| 12,000 | Y = $35,000 + ($3 x 12,000) | $71,000 |
| 20,000 | Y = $35,000 + ($3 x 20,000) | $95,000 |
When using this approach, Amantha’s Artistry must be certain that it is only predicting costs for its relevant range. For example, if the business expands over 40,000 treats, the business would need to expand and rent a larger premises.
Why do we need to distinguish between fixed and variable costs?
Distinguishing between fixed and variable costs is critical because the total cost is the sum of all fixed costs (the total fixed costs) and all variable costs (the total variable costs). For every unit produced, every customer served, or every hotel room rented, for example, managers can determine their total costs both per unit of activity and in total by combining their fixed and variable costs together.
The graphic in (Figure) illustrates the concept of total costs.
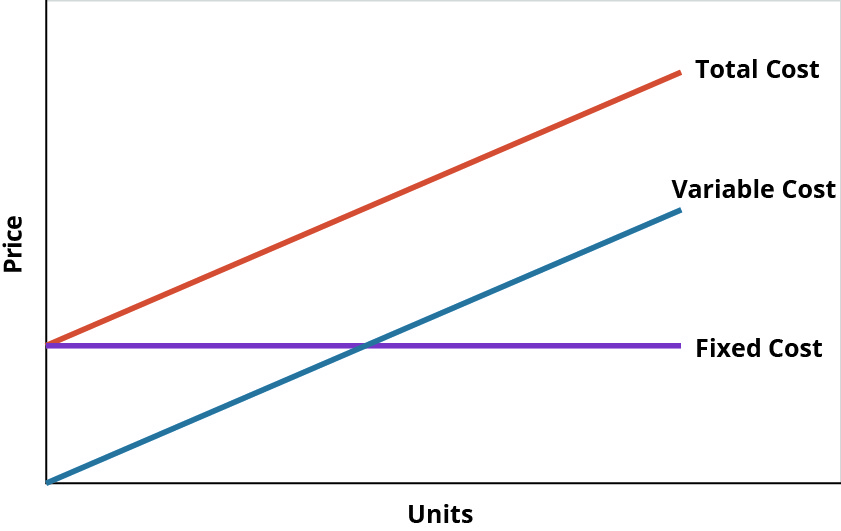
Total Cost as the Sum of Total Fixed Costs and Total Variable Costs. (attribution: Copyright Rice University, OpenStax, under CC BY-NC-SA 4.0 license)
Remember that the reason that businesses take the time and effort to classify costs as either fixed or variable is to be able to control costs. When they classify costs properly, managers can use cost data to make decisions and plan for the future of the business.
Example – Boeing
If you’ve ever flown on an airplane, there’s a good chance you know Boeing. The Boeing Company generates around $90 billion each year from selling thousands of airplanes to commercial and military customers around the world. It employs around 200,000 people, and it’s indirectly responsible for more than a million jobs through its suppliers, contractors, regulators, and others. Its main assembly line in Everett, WA (USA), is housed in the largest building in the world, a colossal facility that covers nearly a half-trillion cubic feet. Boeing is, simply put, a massive enterprise.
And yet, Boeing’s managers know the exact cost of everything the company uses to produce its airplanes: every propeller, flap, seat belt, welder, computer programmer, and so forth. Moreover, they know how those costs would change if they produced more airplanes or fewer. They also know the price at which they sold each plane and the profit the company made on each sale. Boeing’s executives expect their managers to know this information, in real time, if the company is to remain profitable.
Test your understanding
Test you understanding of fixed, variable and mixed costs before we move onto using these costs to conduct cost-volume-profit (CVP) analysis.
