Perform break-even sensitivity analysis for a multi-product environment
Mitchell Franklin; Patty Graybeal; Dixon Cooper; and Amanda White
Up to this point in our CVP analysis, we have assumed that a business only sells one product, but we know that, realistically, this is not the case. Most businesses operate in a multi-product environment, in which they sell different products, manufacture different products, or offer different types of services. Businesses price each one of their products or services differently, and the costs associated with each of those products or services vary as well. In addition, companies have limited resources, such as time and labour, and must decide which products to sell or produce and in what quantities, or which services to offer in order to be the most profitable. These profitability considerations are often helps a business decide on its sales mix – the rough proportions of their products that they plan to sell.
The basics of break-even analysis in a multi-product environment
In order to perform a break-even analysis for a company that sells multiple products or provides multiple services, it is important to understand the concept of a sales mix. A sales mix represents the relative proportions of the products that a company sells—in other words, the percentage of the company’s total revenue that comes from product A, product B, product C, and so forth. Sales mix is important to business owners and managers because they seek to have a mix that maximises profit, since not all products have the same profit margin. Businesses can maximise their profits if they are able to achieve a sales mix that is heavy with high-margin products, goods, or services. If a company focuses on a sales mix heavy with low-margin items, overall profitability will often suffer.
Performing a break-even analysis for these multi-product businesses is more complex because each product has a different selling price, a different variable cost, and, ultimately, a different contribution margin. We must also proceed under the assumption that the sales mix remains constant; if it does change, the CVP analysis must be revised to reflect the change in sales mix. For the sake of clarity, we will also assume that all costs are companywide costs, and each product contributes toward covering these companywide costs.
Example – Selling sandwiches
You are the manager of a sandwich shop located near a university campus. The university has recently added a fast-food style café to the university food court, which has reduced the number of students eating at your shop. Your highest margin items are drinks (a contribution margin of approximately 90%) and vegetarian subs (a contribution margin of approximately 75%). How can you use CVP analysis to help you compete with the university’s food court cafe? What would you suggest as possible ways to increase business while maintaining target income levels?
To conduct appropriate CVP analysis we need to know
- contribution margin for each product
- the existing sales mix of products
Calculating break-even analysis in a multi-product environment
When a business sells more than one product or provides more than one service, break-even analysis is more complex because not all of the products sell for the same price or have the same costs associated with them: Each product has its own margin. Consequently, the break-even point in a multi-product environment depends on the mix of products sold. Further, when the mix of products changes, so does the break-even point. If demand shifts and customers purchase more low-margin products, then the break-even point rises. Conversely, if customers purchase more high-margin products, the break-even point falls. In fact, even if total sales dollars remain unchanged, the break-even point can change based on the sales mix. Let’s look at an example of how break-even analysis works in a multi-product environment.
In multi-product CVP analysis, the company’s sales mix is viewed as a composite unit, a selection of discrete products associated together in proportion to the sales mix. The composite unit is not sold to customers but is a concept used to calculate a weighted average unit contribution margin, which is then used to estimate the break-even point. Think of a weighted average unit as a virtual basket of fruit that contains the proportion of individual fruits equal to the company’s sales mix. If we purchased these items individually to make the fruit basket, each one would have a separate price and a different contribution margin. This is how a weighted average unit works in CVP analysis. We calculate the contribution margins of all of the component parts of the weighted average unit and then use the total to calculate the break-even point. It is important to note that fixed costs are allocated among the various components (products) that make up this weighted average unit. Should a product be eliminated from the weighted average unit or sales mix, the fixed costs must be re-allocated among the remaining products.
If we use the fruit basket as an example, we can look at the individual fruits that make up the basket: apples, oranges, bananas, and pears. We see that each individual fruit has a selling price and a cost. Each fruit has its own contribution margin. But how would we determine the contribution margin for a weighted average of fruit, or in other words, for our basket of fruit?
For our particular baskets, we will use 5 apples, 3 oranges, 2 bananas, and 1 pear. This means that our product mix is 5:3:2:1, as shown in (Figure).
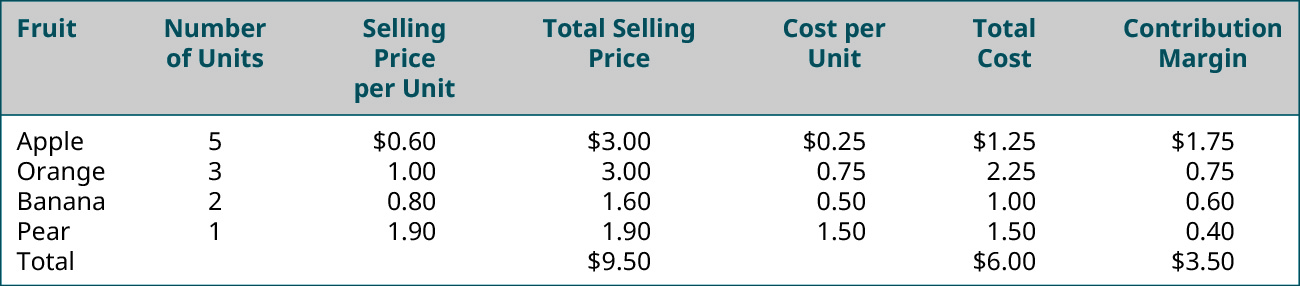
Notice that the composite contribution margin is based on the number of units of each item that is included in the composite item. If we change the composition of the basket, then the composite contribution margin would change even though contribution margin of the individual items would not change. For example, if we only include 4 apples, the contribution margin of a single apple is still $0.35, but the contribution margin of the apples in the basket is $1.40, not $1.75 as it is when 5 apples are included in the basket. Let’s look at an additional example and see how we find the break-even point for this weighted average basket.
Practical example
Let’s meet Soul Sisters – they are a social enterprise who work with refugee women to help develop their seamstress skills while producing ethical fashion. They currently make three clothing items – a long sleeve blouse, a pair of work pants and a work skirt with pockets. Each item has its own sales price, variable cost and contribution margin, as shown below:
| Sales price per item | Variable cost per item | Contribution margin | |
| Long sleeve blouse | $150 | $75 | $75 |
| Work pants | $140 | $50 | $90 |
| Work skirt | $115 | $65 | $50 |
The sales mix is that if the business sold 10 products – 6 would be blouses, 3 would be work pants and 1 would be a work skirt.
Our next step is to calculate a weighted average contribution margin:
| Contribution margin | Mix | Weighted contribution margin (CM x Mix) |
|
| Long sleeve blouse | $75 | 60% | $45 |
| Work pants | $90 | 30% | $27 |
| Work skirt | $50 | 10% | $5 |
| Weighted average contribution margin for one unit | $77 | ||
What is the break even point? To do this, we need to know the fixed costs. Soul Sisters tells us that fixed costs are $13,860. We use the weighted average contribution margin in the same way as we would use the contribution margin to calculate the break even point:
= $13,860 / $77
= 180 units
However, we don’t actually sell this weighted average unit. So we need to break up the 180 units into the 3 different products using our mix of 60%. 30% and 10%.
| Total break even units | Mix | Break even sales in units | |
| Long sleeve blouse | 180 | 60% | 108 |
| Work pants | 180 | 30% | 54 |
| Work skirt | 180 | 10% | 18 |
Using a forecasted or estimated contribution margin income statement, let’s verify that the break even sales in units at Soul Sisters is correct.
| SOUL SISTERS Forecasted Contribution Margin Income Statement |
|
| Sales | |
| Long sleeve blouse (108 x $75) | 16,200 |
| Work pants (54 x $90) | 7,560 |
| Work skirt (18 x $50) | 2,070 |
| Total sales | 25,830 |
| Less Variable Costs | |
| Long sleeve blouse (108 x $75) | 8,100 |
| Work pants (54 x $50) | 2,700 |
| Work skirt (18 x $65) | 1,170 |
| Total variable costs | 11,970 |
| CONTRIBUTION MARGIN | 13,860 |
| Fixed costs | 13,860 |
| NET PROFIT/INCOME | 0 |
Soul Sisters can use this CVP analysis for a wide range of business decisions and for planning purposes. Remember, however, that if the sales mix changes from its current ratio, then the break-even point will change. For planning purposes, Soul Sisters can change the sales mix, sales price, or variable cost of one or more of the products in the composite unit and perform a “what-if” analysis.
One way that businesses can easily conduct this analysis is by building a CVP sensitivity analysis template. We’ve provided one for you below that can be used in various situations.
Break even and CVP analysis – multi-product
