Horizontal and vertical analysis
Mitchell Franklin; Patty Graybeal; Dixon Cooper; and Amanda White
Horizontal and vertical analysis are two types of analysis you can do that use simple mathematical formulas. Ideally, two years (or periods) of data is required to conduct these types of analysis because knowing the horizontal or vertical analysis for one year of a business is useful, but you obtain greater insights by observing firm trends over time.
Horizontal Analysis
Horizontal analysis (also known as trend analysis) looks at trends over time on various financial statement line items. A business will look at one period (usually a year) and compare it to another period. For example, a business may compare sales from their current year to sales from the prior year. The trending of items on these financial statements can give a business valuable information on overall performance and specific areas for improvement. It is most valuable to do horizontal analysis for information over multiple periods to see how change is occurring for each line item. If multiple periods are not used, it can be difficult to identify a trend. The year being used for comparison purposes is called the base year (usually the prior period). The year of comparison for horizontal analysis is analysed for dollar and percent changes against the base year.
The dollar change is found by taking the dollar amount in the base year and subtracting that from the year of analysis.

Using Mistborn Trading (MT) as our example, if MT wanted to compare Revenue in the current year (year of analysis) of $120,000 to the prior year (base year) of $100,000, the dollar change would be as follows:
Dollar change = $120,000 – $100,000 = $20,000
The percentage change is found by taking the dollar change, dividing by the base year amount, and then multiplying by 100.

Let’s compute the percentage change for Mistborn Trading’s revenue.
Percentage change = (20,000 / 100,000)*100 = 20%
This means Mistborn Trading saw an increase of $20,000 in revenue in the current year as compared to the prior year, which was a 20% increase. The same dollar change and percentage change calculations would be used for the income statement line items as well as the balance sheet line items. The figure below shows the complete horizontal analysis of the income statement and balance sheet for Mistborn Trading.
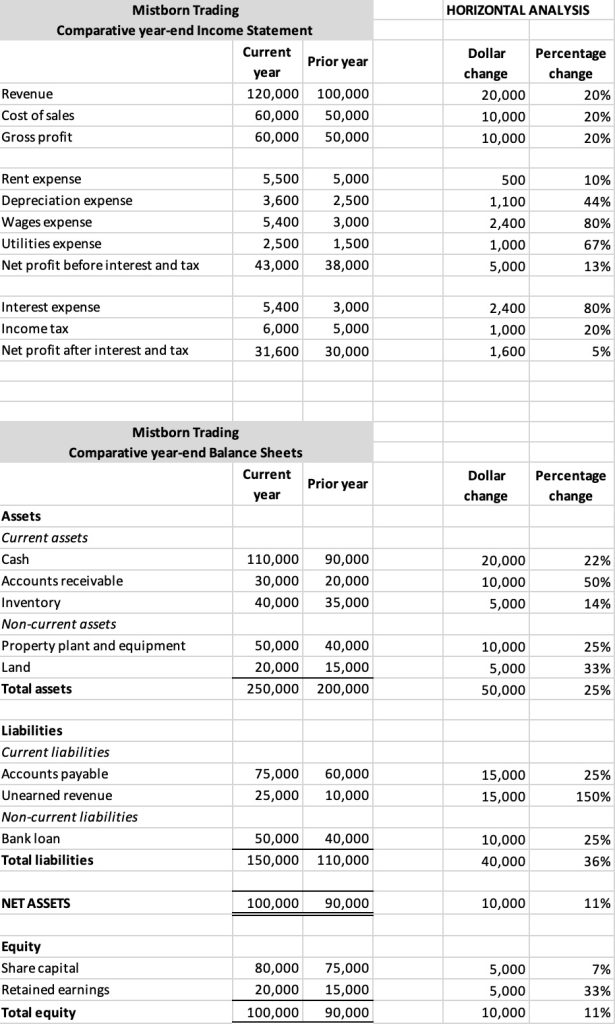
Depending on their expectations, Mistborn Trading could make decisions to alter operations to produce expected outcomes. For example, MT saw a 50% accounts receivable increase from the prior year to the current year. If they were only expecting a 20% increase, they may need to explore this line item further to determine what caused this difference and how to correct it going forward. It could possibly be that they are extending credit to customers more readily than anticipated or not collecting as rapidly on outstanding accounts receivable. The company will need to further examine this difference before deciding on a course of action. Another method of analysis MT might consider before making a decision is vertical analysis.
Vertical Analysis
Vertical analysis shows a comparison of a line item within a statement to another line item within that same statement. For example, a business may compare cash to total assets in the current year. This allows a business to see what percentage of cash (the comparison line item) makes up total assets (the other line item) during the period. This is different from horizontal analysis, which compares across years. Vertical analysis compares line items within a statement in the current year. This can help a business to know how much of one item is contributing to overall operations. For example, a business may want to know how much inventory contributes to total assets. They can then use this information to make business decisions such as preparing the budget, cutting costs, increasing revenues, or investments in property plant or equipment.
The business will need to determine which line item they are comparing all items to within that statement and then calculate the percentage makeup. These percentages are considered common-size because they make businesses within industry comparable by taking out fluctuations for size. It is typical for an income statement to use revenue (or sales) as the comparison line item. This means revenue will be set at 100% and all other line items within the income statement will represent a percentage of revenue.
On the balance sheet, a company will typically look at two areas: (1) total assets, and (2) total liabilities and shareholders’ equity. Total assets will be set at 100% and all assets will represent a percentage of total assets. Total liabilities and shareholders’ equity will also be set at 100% and all line items within liabilities and equity will be represented as a percentage of total liabilities and stockholders’ equity. The line item set at 100% is considered the base amount and the comparison line item is considered the comparison amount. The formula to determine the common-size percentage is:

For example, if Mistborn Trading set total assets as the base amount and wanted to see what percentage of total assets were made up of cash in the current year, the following calculation would occur.
Common-size percentage= ($110,000 / $250,000) * 100 = 44%
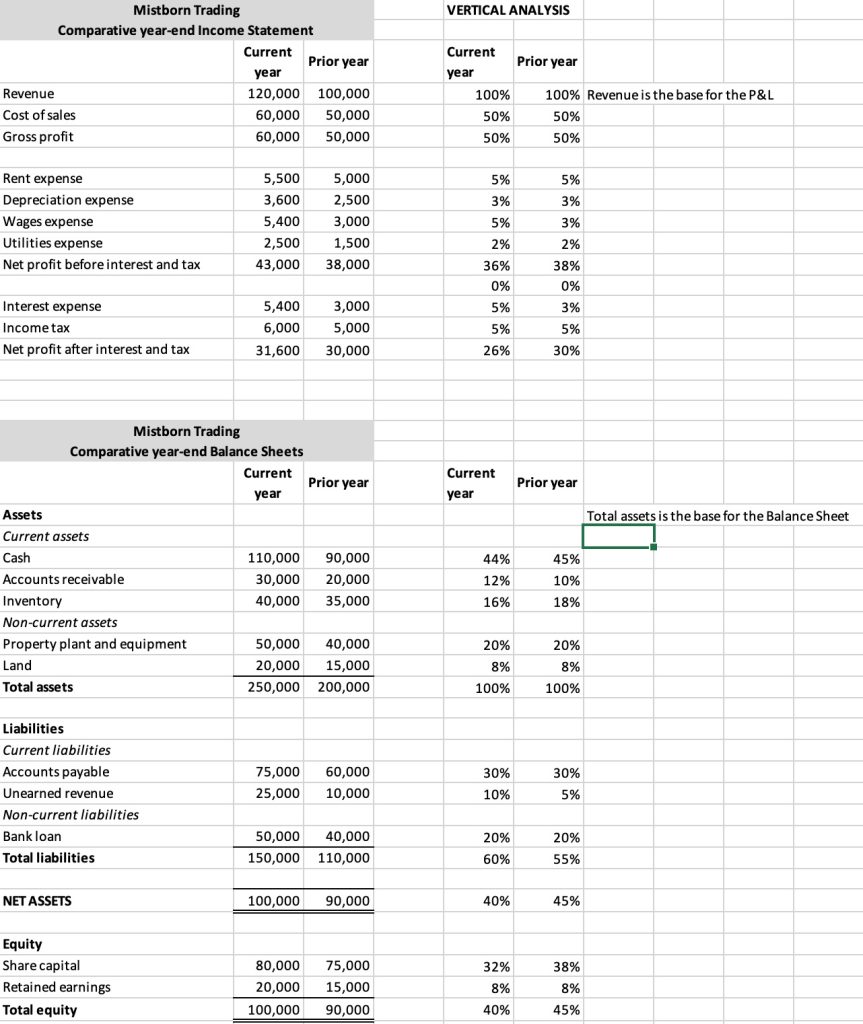
Cash in the current year is $110,000 and total assets equal $250,000, giving a common-size percentage of 44%. If the company had an expected cash balance of 40% of total assets, they would be exceeding expectations. This may not be enough of a difference to make a change, but if they notice this deviates from industry standards, they may need to make adjustments, such as reducing the amount of cash on hand to reinvest in the business. The figure below shows the common-size calculations on the comparative income statements and comparative balance sheets for Mistborn Trading. The highlighted part of the figure shows the number used as the base to create the common-sizing.
But what other forms of analysis are available? In the next section, we will examine ratio analysis.
