Perform break-even sensitivity analysis for a single product
Mitchell Franklin; Patty Graybeal; Dixon Cooper; and Amanda White
Finding the break-even point or the sales necessary to meet a desired profit is very useful to a business, but cost-volume-profit analysis also can be used to conduct a sensitivity analysis, which shows what will happen if the sales price, units sold, variable cost per unit, or fixed costs change. Businesses use this type of analysis to consider possible scenarios that assist them in planning. It allows businesses to say “what if?” and consider the possible outcomes.
The effects on break-even under changing business conditions
Circumstances often change within a business, within an industry, or even within the economy that impact the decision-making of an organisation. Sometimes, these effects are sudden and unexpected, for example, if a flood destroyed the factory of a business’s major supplier; other times, they occur more slowly, such as when union negotiations affect your labour costs. In either of these situations, costs to the business will be affected. Using CVP analysis, the business can predict how these changes will affect profits.
Changing a single variable
To demonstrate the effects of changing any one of these variables, consider Back Door Café, a small coffee shop that roasts its own beans to make coffee. They also sell a variety of baked goods and T-shirts with their logo on them. They track their costs carefully and use CVP analysis to make sure that their sales cover their fixed costs and provide a reasonable level of profit for the owners. There are 3 potential components that could be changed – the sales price, the variable costs or the fixed costs. Let’s analyse the impact of a change of each of these (in isolation, not compounded)
Change in sales price
The owner of Back Door has one of her employees conduct a survey of the other coffee shops in the area and finds that competitors are charging $0.75 more for coffee. As a result, the owner wants to determine what would happen to operating income if she increased her price by just $0.50 and sales remained constant, so she performs the following analysis:
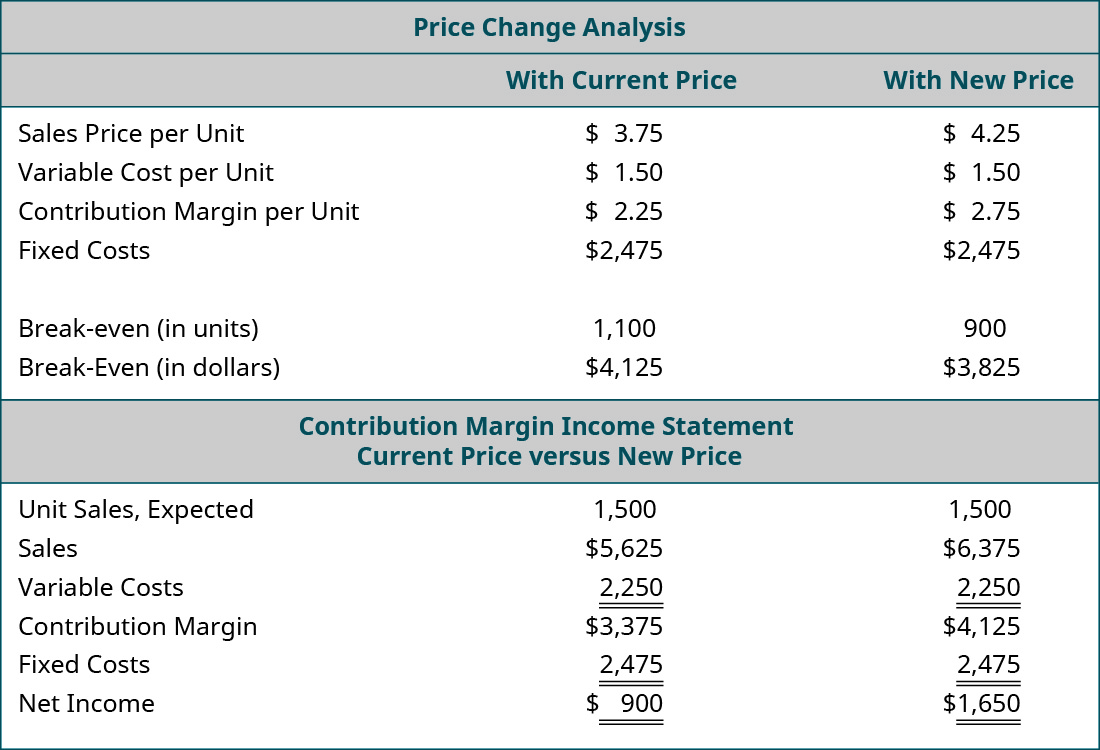
The only variable that has changed is the $0.50 increase in the price of their coffee drinks, but the net profit/income will increase by $750. Another way to think of this increase in profit is that, if the sales price increases by $0.50 per coffee drink and the estimated sales are 1,500 units, then this will result in an increase in overall contribution margin of $750. Moreover, since all of the fixed costs were met by the lower sales price, all of this $750 goes to profit. Again, this is assuming the higher sales price does not decrease the number of units sold. Since the other coffee shops will still be priced higher than Back Door, the owner believes that there will not be a decrease in sales volume.
When making this adjustment to their sales price, Back Door Café is engaging in target pricing, a process in which a company uses market analysis and production information to determine the maximum price customers are willing to pay for a good or service. If the good can be produced at a cost that allows both the desired profit percentage as well as deliver the good at a price acceptable to the customer, then the company should proceed with the product; otherwise, the company will not achieve its desired profit goals.
Change in variable cost
In March, the owner of Back Door receives a letter from her cups supplier informing her that there is a $0.05 price increase due to higher material prices. Assume that the example uses the original $3.75 per unit sales price. The owner wants to know what would happen to net profit/income if she absorbs the cost increase (not passing it on to her customers), so she performs the following analysis:
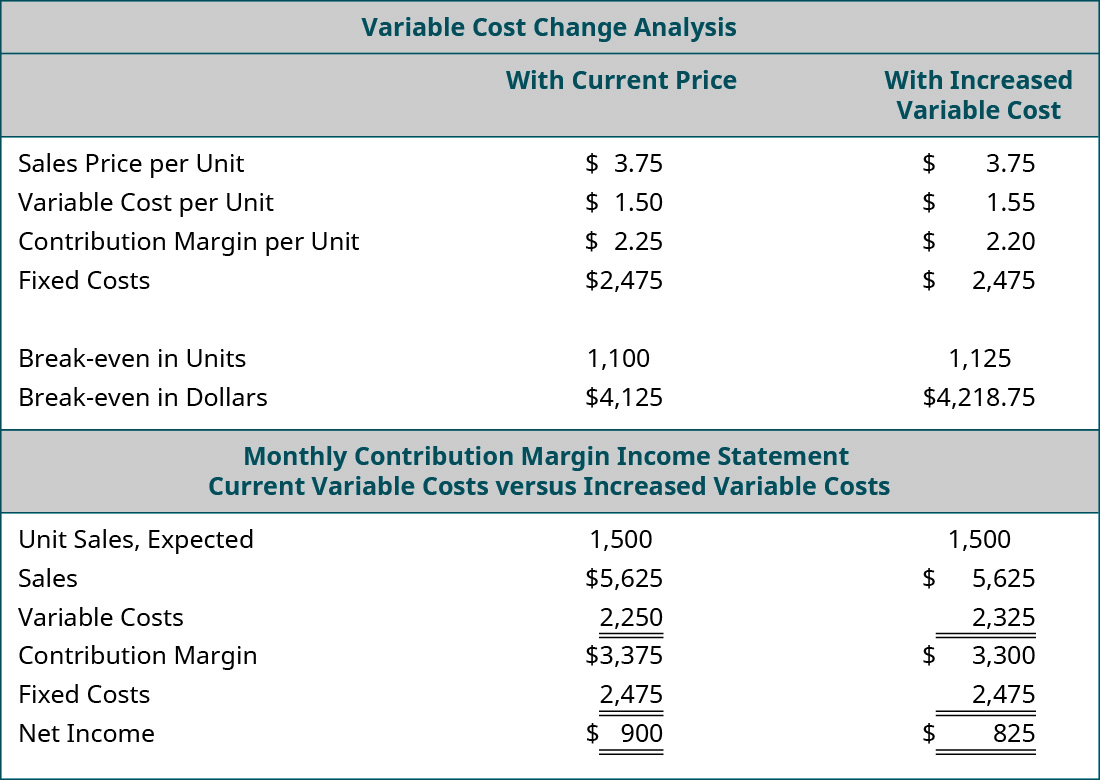
She is surprised to see that just a $0.05 increase in variable costs (cups) will reduce her net income by $75. The owner may decide that she is fine with the lower income, but if she wants to maintain her income, she will need to find a new cup supplier, reduce other costs, or pass the price increase on to her customers. Because the increase in the cost of the cups was a variable cost, the impact on net profit/income can be seen by taking the increase in cost per unit, $0.05, and multiplying that by the units expected to be sold, 1,500, to see the impact on the contribution margin, which in this case would be a decrease of $75. This also means a decrease in net income of $75.
Change in fixed cost
Back Door Café’s lease is coming up for renewal. The owner calls the landlord to indicate that she wants to renew her lease for another 5 years. The landlord is happy to hear she will continue renting from him but informs her that the rent will increase $225 per month. She is not certain that she can afford an additional $225 per month and tells him she needs to look at her numbers and will call him back. She pulls out her CVP spreadsheet and adjusts her monthly fixed costs upwards by $225. Assume that the example uses the original $3.75 per unit sales price for coffee drinks. The results of her analysis of the impact of the rent increase on her annual net income are:
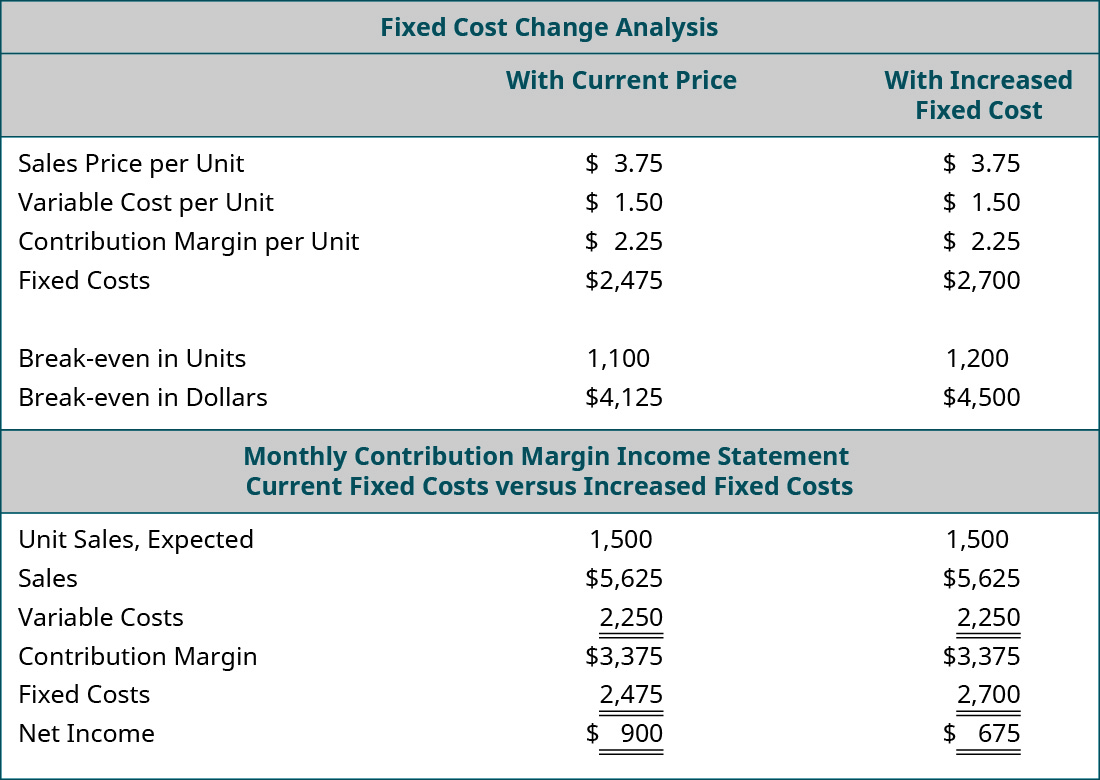
Because the rent increase is a change in a fixed cost, the contribution margin per unit remains the same. However, the break-even point in both units and dollars increase because more units of contribution are needed to cover the $225 monthly increase in fixed costs. If the owner of the Back Door agrees to the increase in rent for the new lease, she will likely look for ways to increase the contribution margin per unit to offset this increase in fixed costs.
In each of the prior examples, only one variable was changed— sales price, variable costs, or fixed costs. There are some generalisations or rules of thumb that can be made regarding how a change in any one of these variables affects the break-even point. These general rules of thumb are summarised in the table below
Rules of thumb regarding changes in break-even point from a change in one variable |
|
|---|---|
| Condition | Result |
| Sales Price Increases | Break-Even Point Decreases (Contribution Margin is Higher, Need Fewer Sales to Break Even) |
| Sales Price Decreases | Break-Even Point Increases (Contribution Margin is Lower, Need More Sales to Break Even) |
| Variable Costs Increase | Break-Even Point Increases (Contribution Margin is Lower, Need More Sales to Break Even) |
| Variable Costs Decrease | Break-Even Point Decreases (Contribution Margin is Higher, Need Fewer Sales to Break Even) |
| Fixed Costs Increase | Break-Even Point Increases (Contribution Margin Does Not Change, but Need More Sales to Meet Fixed Costs) |
| Fixed Costs Decrease | Break-Even Point Decreases (Contribution Margin Does Not Change, but Need Fewer Sales to Meet Fixed Costs) |
Changing multiple variables
We have analysed situations in which one variable changes, but often, more than one change will occur at a time. For example, a business may need to lower its selling price to compete, but they may also be able to lower certain variable costs by switching suppliers.
Suppose Back Door Café has the opportunity to purchase a new espresso machine that will reduce the amount of coffee beans required for an espresso drink by putting the beans under higher pressure. The new machine will cost $15,000, but it will decrease the variable cost per cup by $0.05. The owner wants to see what the effect will be on the net income and break-even point if she purchases the new machine. She has arranged financing for the new machine and the monthly payment will increase her fixed costs by $400 per month. When she conducts this analysis, she gets the following results:
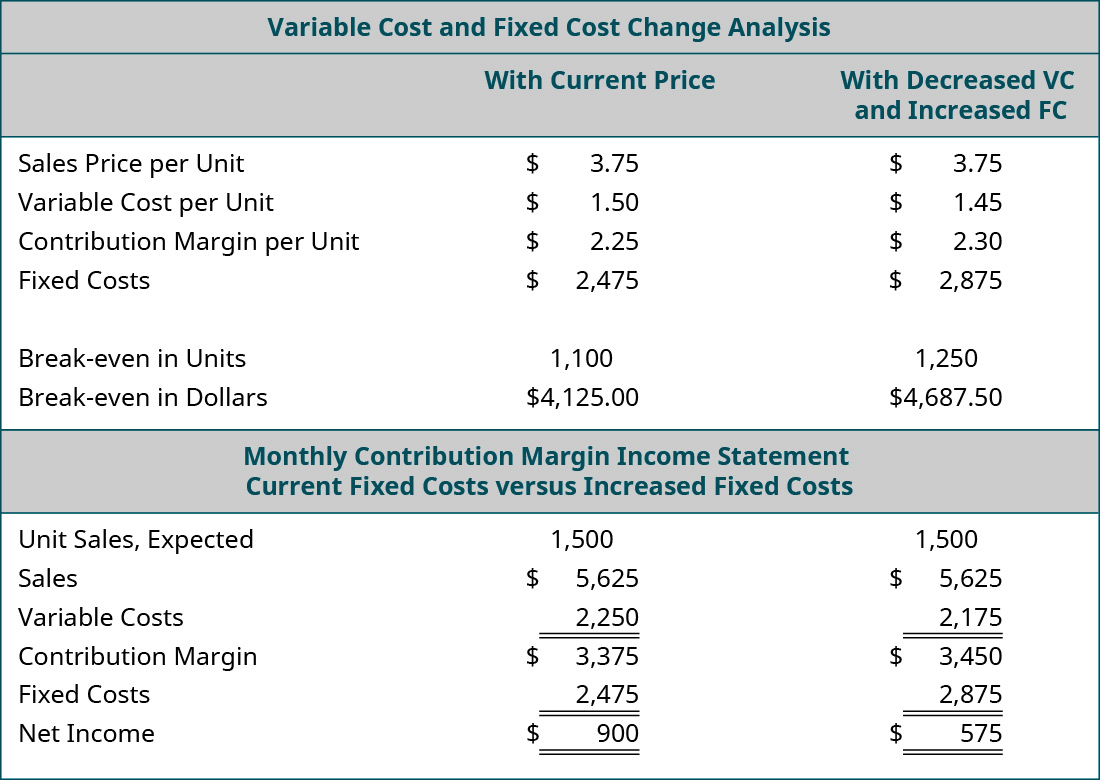
Looking at the “what-if” analysis, we see that the contribution margin per unit increases because of the $0.05 reduction in variable cost per unit. As a result, she has a higher total contribution margin available to cover fixed expenses. This is good, because the monthly payment on the espresso machine represents an increased fixed cost. Even though the contribution margin ratio increases, it is not enough to totally offset the increase in fixed costs, and her monthly break-even point has risen from $4,125.00 to $4,687.50. If the new break-even point in units is a realistic number (within the relevant range), then she would decide to purchase the new machine because, once it has been paid for, her break-even point will fall and her net profit/income will rise. Performing this analysis is an effective way for managers and business owners to look into the future, so to speak, and see what impact business decisions will have on their financial position.
Let’s look at another option the owner of the Back Door Café has to consider when making the decision about this new machine. What would happen if she purchased the new machine to realise the variable cost savings and also raised her price by just $0.20? She feels confident that such a small price increase will go virtually unnoticed by her customers but may help her offset the increase in fixed costs. She runs the analysis as follows:
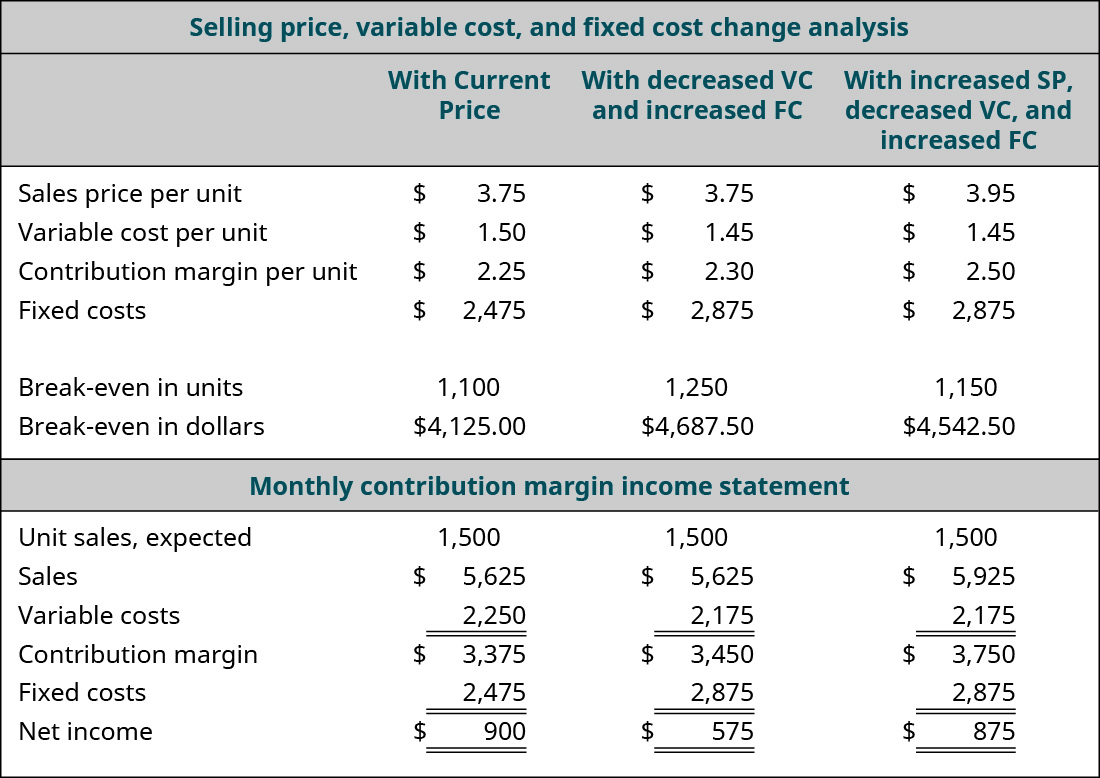
The analysis shows the expected result: an increase in the per-unit contribution margin, a decrease in the break-even point, and an increase in the net operating income. She has changed three variables in her costs – sales price, variable cost, and fixed cost. In fact, the small price increase almost gets her back to the net profit/ income she was expecting before the purchase of the new espresso machine.
By now, you should begin to understand why CVP analysis is such a powerful tool. The owner of Back Door Café can run an unlimited number of these what-if scenarios until she meets the financial goals for her company. There are very few tools in managerial accounting as powerful and meaningful as a cost-volume-profit analysis.
How can they sell it that cheap?
If you’ve ever needed a caffeine boost but are low on cash in Australia, you will have likely thought about purchasing a $1 coffee from any 7 Eleven convenience store or at a Woolworths or Coles metro store. But how can they sell coffee so cheaply?
Volume! Although the margin on each unit is very small, these stores hope to make up the difference in quantity. They also hope that consumers will purchase other items while in the store – a donut, some fruit, a chocolate bar or chips – where the margins are much higher for each individual item.
Free tools and templates
Rather than creating sensitivity analysis by hand – you can use an excel template like this one
Test your understanding
By completing the following multiple choice questions in relation to sensitivity analysis
