Ratio analysis
Mitchell Franklin; Patty Graybeal; Dixon Cooper; and Amanda White
Overview of Financial Ratios
Financial ratios help both internal and external users of information make informed decisions about a business. A stakeholder could be looking to invest, become a supplier, make a loan, or alter internal operations, among other things, based in part on the outcomes of ratio analysis. The information resulting from ratio analysis can be used to examine trends in performance, establish benchmarks for success, set budget expectations, and compare industry competitors. There are four main categories of ratios: liquidity, solvency, efficiency, and profitability. Note that while there are more ideal outcomes for some ratios, the industry in which the business operates can change the influence each of these ratios has over stakeholder decisions. You will learn more about ratios, industry standards, and ratio interpretation if you go on to study accounting or finance in more detail.
Liquidity Ratios
Liquidity ratios show the ability of the business to pay short-term obligations if they came due immediately with assets that can be quickly converted to cash. This is done by comparing current assets to current liabilities. Lenders, for example, may consider the outcomes of liquidity ratios when deciding whether to extend a loan to a company. A business would like to be liquid enough to manage any currently due obligations but not too liquid where they may not be effectively investing in growth opportunities. Three common liquidity measurements are working capital, current ratio, and quick ratio.
Working Capital
Working capital measures the financial health of an organisation in the short-term by finding the difference between current assets and current liabilities. A business will need enough current assets to cover current liabilities; otherwise, they may not be able to continue operations in the future. Before a lender extends credit, they will review the working capital of the business to see if the business can meet their obligations. A larger difference signals that a business can cover their short-term debts and a lender may be more willing to extend the loan. On the other hand, too large of a difference may indicate that the business may not be correctly using their assets to grow the business. The formula for working capital is:

Using Mistborn Trading, working capital is computed as follows for the current year:
Working capital = 180,000 – 100,000 = $80,000
In this case, current assets were $180,000, and current liabilities were $100,000. Current assets were far greater than current liabilities for Mistborn Trading and they would easily be able to cover short-term debst.
The dollar value of the difference for working capital is limited given company size and scope. It is most useful to convert this information to a ratio to determine the business’s current financial health. This ratio is the current ratio.
Current Ratio
Working capital expressed as a ratio is the current ratio. The current ratio considers the amount of current assets available to cover current liabilities. The higher the current ratio, the more likely the company can cover its short-term debt. The formula for current ratio is:
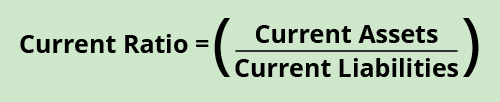
The current ratio in the current year for Mistborn Trading is:
Current ratio = (180,000 / 100,000) = 1.8
A 1.8 ratio means the business has 180% as many current assets as current liabilities; typically, this would be plenty to cover obligations. This may be an acceptable ratio for Mistborn Trading, but if it is too high (for example if the current ratio was 10), they may want to consider using those assets in a different way to grow the business.
Quick Ratio
The quick ratio, also known as the acid-test ratio, is similar to the current ratio except current assets are more narrowly defined as the most liquid assets, which exclude inventory and prepaid expenses. The conversion of inventory and prepaid expenses to cash can sometimes take more time than the liquidation of other current assets. A business will want to know what they have on hand and can use quickly if an immediate obligation is due. The formula for the quick ratio is:
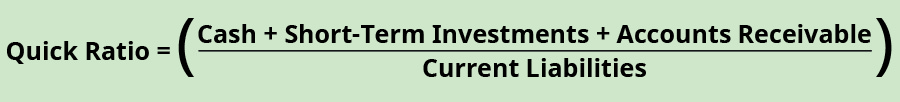
The quick ratio for Mistborn Trading in the current year is:
Quick ratio = (140,000 / 100,000) = 1.4
A 1.4 ratio means the business has enough quick assets to cover current liabilities. When evaluating a business, we want to see that the quick ratio is above 1. A quick ratio below one means that the business does not have enough liquid assets to pay their debts and may be at risk of being insolvent.
Another category of financial measurement uses solvency ratios.
Solvency Ratios
Solvency implies that a business can meet its long-term obligations and will likely stay in business in the future. To stay in business the company must generate more revenue than debt in the long-term. Meeting long-term obligations includes the ability to pay any interest incurred on long-term debt. Two main solvency ratios are the debt-to-equity ratio and the times interest earned ratio.
Debt to Equity Ratio
The debt-to-equity ratio shows the relationship between debt and equity as it relates to business financing. A business can take out loans, issue shares, and retain earnings to be used in future periods to keep operations running. It is less risky and less costly to use equity sources for financing (issue shares) as compared to debt resources (obtain a loan). This is mainly due to interest expense repayment that a loan carries as opposed to equity, which does not have this requirement. Therefore, a business wants to know how much debt and equity contribute to its financing. Ideally, a buisiness would prefer more equity than debt financing. The formula for the debt to equity ratio is:
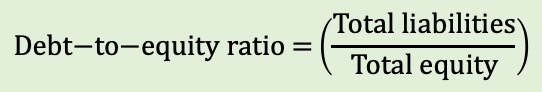
The information needed to compute the debt-to-equity ratio for Mistborn Trading in the current year can be found on the balance sheet.
Debt to equity ratio = (150,000 / 100,000) = 1.5
This means that for every $1 of equity (contributions from shareholders and past earnings of the firm), $1.50 is contributed from lenders. This could be a concern for Mistborn Trading. This could be a red flag for potential investors that the business could be trending toward insolvency because they have too many obligations. MT might want to get the ratio below 1:1 to improve their long-term business viability.
Times Interest Earned Ratio
Time interest earned measures the business’s ability to pay interest expense on long-term debt incurred. This ability to pay is determined by the available earnings (profit) before interest and taxes (EBIT) are deducted. These earnings are considered the operating income. Lenders will pay attention to this ratio before extending credit. The more times over a business can cover interest, the more likely a lender will extend long-term credit. The formula for times interest earned is:
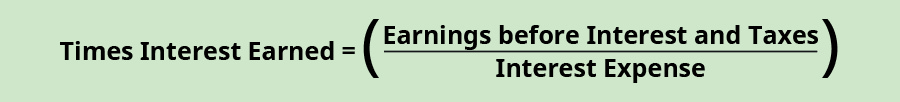
The information needed to compute times interest earned for Mistborn Trading in the current year can be found on the income statement.
Times interest earned = (43,000 / 5,400) = 7.96
The $43,000 is the net profit before interest and tax. The 7.96 times outcome suggests that Mistborn Trading can easily repay interest on an outstanding loan and creditors would have little risk that Mistborn Trading would be unable to pay. However, this idea that they could easily repay interest could change if the business obtained loans or interest rates changed. It could also change if the business environment changes – affecting their ability to generate revenue and the expenses they incur.
Another category of financial measurement uses efficiency ratios.
Efficiency Ratios
Efficiency shows how well a business uses and manages their assets. Areas of importance with efficiency are management of sales, accounts receivable, and inventory. A business that is efficient typically will be able to generate revenues quickly using the assets it acquires. Let’s examine four efficiency ratios: accounts receivable turnover, total asset turnover, inventory turnover, and days’ sales in inventory.
Accounts Receivable Turnover
Accounts receivable turnover measures how many times in a period (usually a year) a business will collect cash from accounts receivable. A higher number of times could mean cash is collected more quickly and that credit customers are of high quality. A higher number is usually preferable because the cash collected can be reinvested in the business at a quicker rate. A lower number of times could mean cash is collected slowly on these accounts and customers may not be properly qualified to accept the debt. The formula for accounts receivable turnover is:
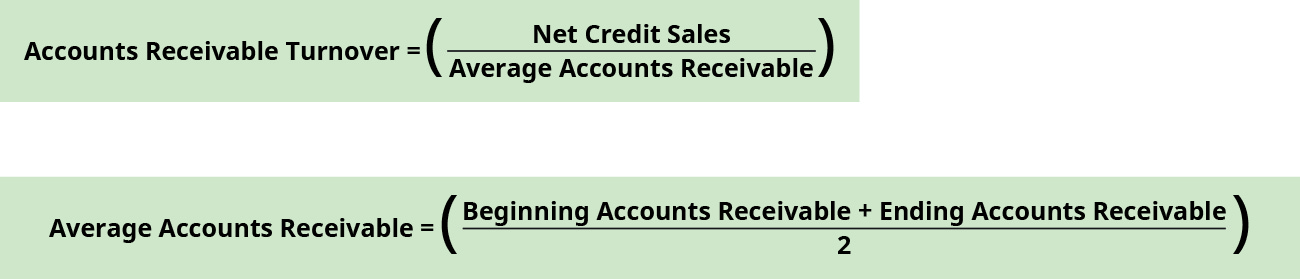
Many businesses do not split credit and cash sales, in which case an assumption is made that all sales are credit sales and therefore total sales or revenue would be used to compute accounts receivable turnover. Average accounts receivable is found by dividing the sum of beginning and ending accounts receivable balances found on the balance sheet. The beginning accounts receivable balance in the current year is taken from the ending accounts receivable balance in the prior year.
When computing the accounts receivable turnover for Mistborn Trading, let’s assume net credit sales make up $100,000 of the $120,000 of the revenue found on the income statement in the current year.
Accounts receivable turnover = (100,000/ (20,000+30,000)/2)
Accounts receivable turnover = (100,000/ 25,000) = 4
An accounts receivable turnover of four times per year may be low for Mistborn Trading. Given this outcome, they may want to consider stricter credit lending practices to make sure credit customers are of a higher quality. They may also need to be more aggressive with collecting any outstanding accounts receivables from customers.
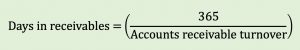
Days in receivables
The days in receivables ratio tells us how many days a customer’s debt is outstanding before they pay. We use the Accounts Receivable Turnover ratio to calculate it.
Therefore for MIstborn Trading, we can calculate the days in receivables as follows:
Days in receivables = 365/4 = 91
This is an extremely long time to wait for customers to pay, and anything could happen to those customers during that period – for example, they could go out of business and therefore be unable to pay you. Collecting sooner is always better and in most industries, the average period of time to give a customer credit is 30 days.
Inventory Turnover
Inventory turnover measures how many times during the year a business has sold and replaced inventory. This can tell a business how well inventory is managed. A higher ratio is preferable; however, an extremely high turnover may mean that the company does not have enough inventory available to meet demand. A low turnover may mean the company has too much supply of inventory on hand. The formula for inventory turnover is:
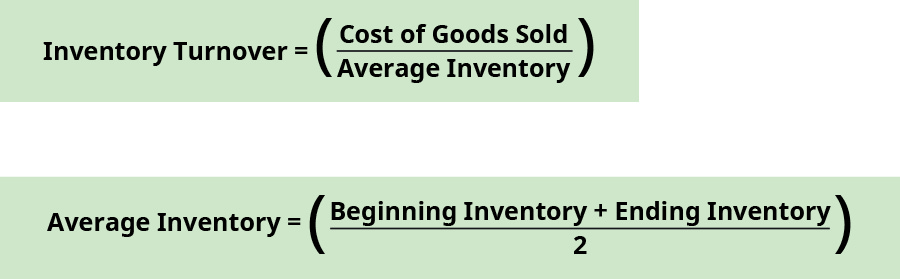
Cost of goods sold (or Cost of sales) for the current year is found on the income statement/P&L. Average inventory is found by dividing the sum of beginning and ending inventory balances found on the balance sheet. The beginning inventory balance in the current year is taken from the ending inventory balance in the prior year.
Mistborn Trading’s inventory turnover is:
Inventory turnover = (60,000 / (35,000+40,000)/2 )
Inventory turnover = (60,000 / 37,500) = 1.6
1.6 times is a very low turnover rate for Mistborn Trading. This may mean the company is maintaining too high an inventory supply to meet a low demand from customers. They may want to decrease their on-hand inventory to free up more liquid assets to use in other ways.
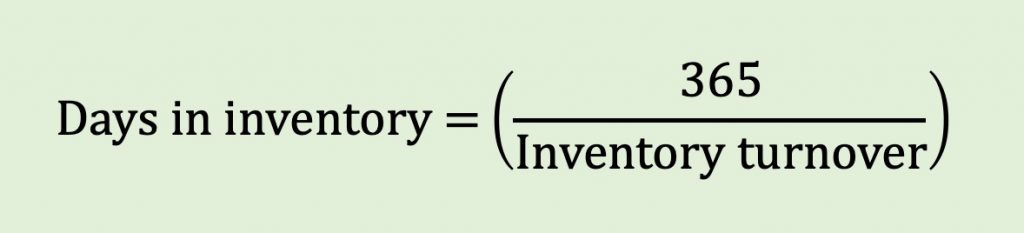
Days’ Sales in Inventory
Days’ sales in inventory expresses the number of days it takes a business to turn inventory into sales. This assumes that no new purchase of inventory occurred within that time period. The fewer the number of days, the more quickly the business can sell its inventory. The higher the number of days, the longer it takes to sell its inventory. The formula for days’ sales in inventory is:
Mistborn Trading’s days’ sales in inventory is:
Days’ sales in inventory = 365/1.6 = 228 days
228 days is a long time to sell inventory. While industry averages dictates what is an acceptable number of days to sell inventory, in most cases 228 days is unsustainable long-term. Mistborn Trading will need to better manage their inventory and sales strategies to move inventory more quickly.
Days sales in inventory should also be examined within the context of the item(s) being sold. A car dealership that sells Aston Martins is likely to have a higher days sales in inventory and lower inventory turnover because it is a luxury product. In comparison, Toyota focuses on making money by selling volume and would expect to have a lower days sales and higher inventory turnover.
Total Asset Turnover
Total asset turnover measures the ability of a business to use their assets to generate revenues. A business would like to use as few assets as possible to generate the most sales or revenue. Therefore, a higher total asset turnover means the business is using their assets very efficiently to produce net sales. The formula for total asset turnover is:
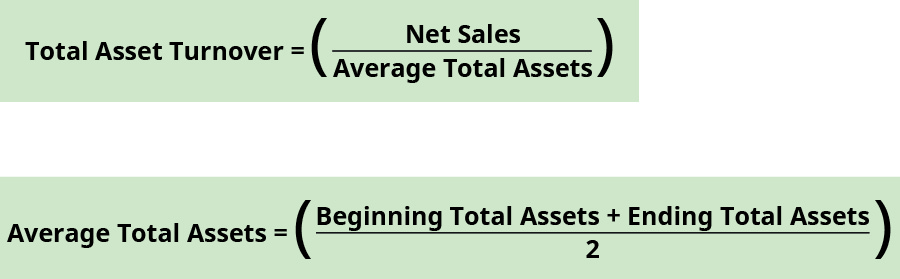
Average total assets are found by dividing the sum of beginning and ending total assets balances found on the balance sheet. The beginning total assets balance in the current year is taken from the ending total assets balance in the prior year.
Mistborn Trading’s total asset turnover is:
Total asset turnover = (120,000 / (200,000+250,000)/2 )
Total asset turnover = (120,000 / 225,000) = 0.53
The outcome of 0.53 means that for every $1 of assets, $0.53 of sales revenue are generated. Over time, Mistborn Trading would like to see this turnover ratio increase.
The last category of financial measurement examines profitability ratios.
Profitability Ratios
Profitability considers how well a business produces returns given their operational performance. The business needs to leverage its operations to increase profit. To assist with profit goal attainment, business revenues need to outweigh expenses. Let’s consider three profitability measurements and ratios: profit margin, return on total assets, and return on equity.
Profit Margin
Profit margin represents how much of sales revenue has translated into income. This ratio shows how much of each $1 of sales is returned as profit. The larger the ratio figure (the closer it gets to 1), the more of each sales dollar is returned as profit. The portion of the sales dollar not returned as profit goes toward expenses. The formula for profit margin is:
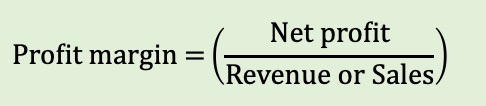
For Mistborn Trading, the profit margin in the current year is:
Profit margin = 31,600 / 120,000 = 0.2633 = 26.33%
This means that for every dollar of sales, $0.26 returns as profit. If Mistborn Trading thinks this is too low, the company could try and find ways to reduce expenses and increase sales.
Return on Assets (ROA)
The return on assets measures the business’s ability to use its assets successfully to generate a profit. The higher the return (ratio outcome), the more profit is created from asset use. Average total assets are found by dividing the sum of beginning and ending total assets balances found on the balance sheet. The beginning total assets balance in the current year is taken from the ending total assets balance in the prior year. The formula for return on total assets is:
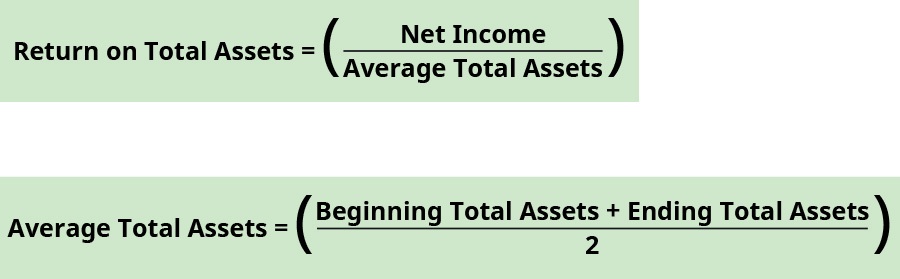
For Mistborn Trading, the return on assets for the current year is:
Return on assets = (31,600 / (200,000+250,000/2) )
Return on assets = (31,600 / 225,000) = 0.1404 = 14.04%
Therefore assets in total are returning $0.14 for every $1 of asset.
The higher the figure, the better the company is using its assets to create a profit. Industry standards can dictate what is an acceptable return.
Return on Equity
Return on equity (ROE) measures the business’s ability to use its invested capital (from shareholders) and retained earnings to generate income. The invested capital comes from shareholders investments in the company’s shares and its retained earnings and is leveraged to create profit. The higher the return, the better the business is at using its investments to yield a profit. The formula for return on equity is:
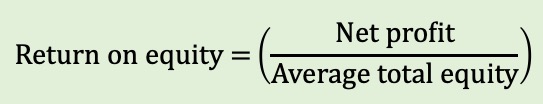
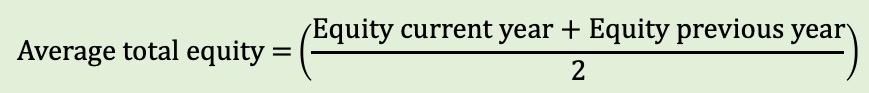
Average total equity is found by dividing the sum of beginning and ending total equity balances. But how do we find these balances? The beginning total equity balance in the current year is taken from the ending total equity balance in the prior year.
For Mistborn Trading, we will use the net income figure and assume no preferred dividends have been paid. The return on equity for the current year is:
Return on equity = (31,600 / (90,000 + 100,000)/2 )
Return on equity = (31,600 / 95,000) = 0.3326 = 33.26%
The higher the figure, the better the business is using the investments by shareholders and past profits to generate further profit. Industry standards can dictate what is an acceptable return.
SOLUTION GUIDE
The entire spreadsheet and solutions for the horizontal analysis, vertical analysis and ratio analysis is provided below. Check out the formulas used in Excel to make it easier to conduct this analysis.
